29Apr

Costco Wholesale Corp. (COST) Elliott Wave Chart Signals Start of Bearish Wave C with Key Support Levels and Trade Setup Potential

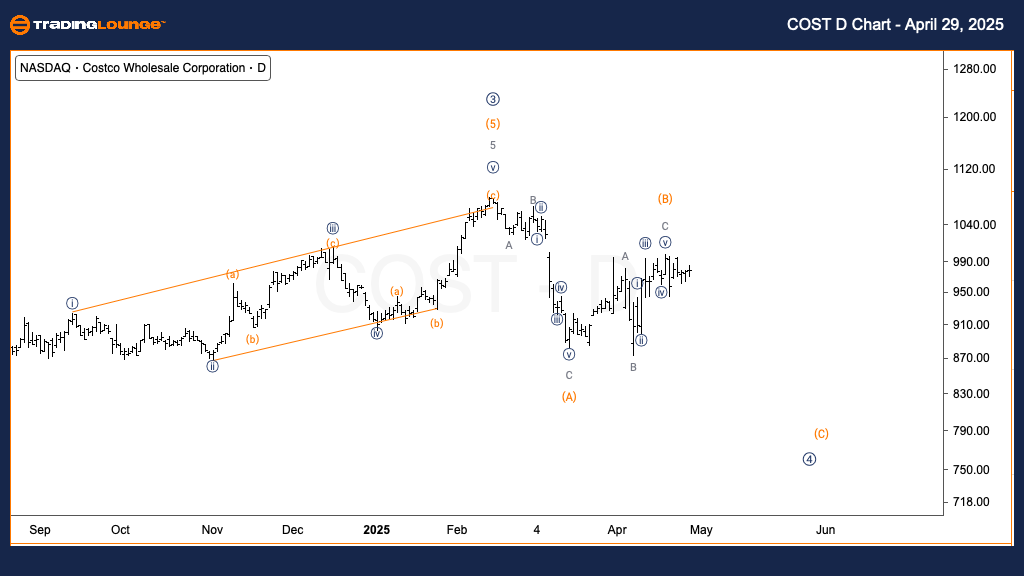
Costco Wholesale Corp. (COST) Elliott Wave Analysis - TradingLounge Daily Chart

COST Elliott Wave Technical Analysis

FUNCTION: Counter Trend

MODE: Corrective

STRUCTURE: Flat

POSITION: Wave (B) of 4

DIRECTION: Downside in wave (C)

DETAILS: Intermediate wave (B) appears to have completed near the key $1000 psychological level. A continued decline is anticipated to confirm the start of wave (C).

Costco’s Elliott Wave daily chart indicates that wave (B) may have finalized around the $1000 resistance zone, a critical psychological barrier. Should this level hold, it reinforces the expectation of a downward move in wave (C), consistent with a broader corrective wave 4 structure.

Wave (C) is likely to extend lower as bearish momentum gains traction. Traders should focus on watching for price rejection near support zones and other technical confirmation signals that support the bearish continuation in wave (C).

COST-US-stock-Day-Ch...


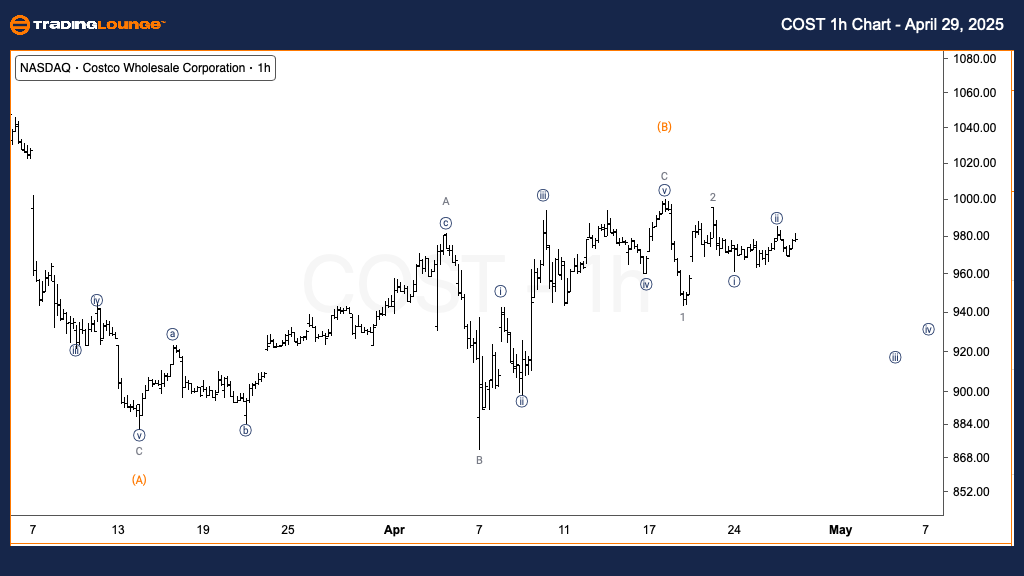
Costco Wholesale Corp. (COST) – 1H Chart Elliott Wave Analysis

COST Elliott Wave Technical Analysis

FUNCTION: Counter Trend

MODE: Corrective

STRUCTURE: Flat

POSITION: Wave 3 of (C)

DIRECTION: Downside in wave 3

DETAILS: Wave (B) top looks established. Emerging nested wave formations suggest wave (C) is intensifying to the downside.

On the 1-hour timeframe, Costco is exhibiting classic signs of a deepening bearish impulse, with nested wave 1 and 2 structures implying that wave 3 of (C) is gaining strength. This suggests an acceleration in downward price action.

Traders should remain alert for breakout confirmation, increasing sell volume, and technical signals that support the continuation of wave 3. This phase of the pattern could yield sharp price movements, offering tactical short-trade setups in line with the Elliott Wave forecast.

Technical Analyst: Alessio Barretta

Source: Visit Tradinglounge.com and learn from the Experts. Join TradingLounge Here 

Previous: Spotify Technology Elliott Wave Technical Analysis

VALUE Offer - Buy 1 Month & Get 3 Months!Click here

Access 7 Analysts Over 200 Markets Covered. Chat Room With Support

COST-US-stock-1h-Cha...

Related

ADANI PORTS and SEZ Elliott Wave Technical Analysis: Stay Updated on Trading Strategies and Stock Trends for 2024

ADANI PORTS and SEZ Elliott Wave Technical Analysis: Stay Updated on Trading Strategies and Stock Trends for 2024

Adani Ports & SEZ stock is progressing within an Elliott Wave impulse structure, targeting levels ab...

Read More >
Expert insights into Coles Group's stock performance: Coles Group Limited Stock Analysis & COL Elliott Wave Technical Forecast

Expert insights into Coles Group's stock performance: Coles Group Limited Stock Analysis & COL Elliott Wave Technical Forecast

Our in-depth Elliott Wave analysis of ASX Coles Group Limited (COL) offers traders a comprehensive v...

Read More >
ASX Stock Trading Success: TRANSURBAN GROUP (TCL) Stock Forecast & TCL Elliott Wave Technical Analysis

ASX Stock Trading Success: TRANSURBAN GROUP (TCL) Stock Forecast & TCL Elliott Wave Technical Analysis

Explore the comprehensive Elliott Wave analysis of ASX TRANSURBAN GROUP (TCL). This analysis covers ...

Read More >
South32 Limited Stock Analysis & Elliott Wave Technical Forecast: Critical Validation Points and Includes a Short-Term Forecast

South32 Limited Stock Analysis & Elliott Wave Technical Forecast: Critical Validation Points and Includes a Short-Term Forecast

This analysis provides an in-depth look at ASX: South32 Limited (S32) using Elliott Wave theory. It ...

Read More >
The Home Depot (HD) Stocks Elliott Wave Technical Analysis: Bearish Trend and Trading Opportunities

The Home Depot (HD) Stocks Elliott Wave Technical Analysis: Bearish Trend and Trading Opportunities

Discover the latest Elliott Wave analysis for The Home Depot (HD), highlighting bearish trends and t...

Read More >
Bharat Electronics Elliott Wave Analysis Reveals Bullish Trend, Share Price Forecast, Trading Strategy, and BEL Indian Stocks Insights

Bharat Electronics Elliott Wave Analysis Reveals Bullish Trend, Share Price Forecast, Trading Strategy, and BEL Indian Stocks Insights

Bharat Electronics shows a strong bullish trend in Elliott Wave analysis, forecasting significant sh...

Read More >

$1 for 2 Weeks

then $29 a month!

What a Special Offer!

Trade Recommendations

Unleash the power of deversified trading with our comprehensive portfolio, covering 250+ markets:

  • Stock Trades
  • Crypto Trades
  • Forex Trades
  • Commodity Trades
Elliott Wave Analysis

Gain a competitive edge with expert insights and AI-powered Elliott Wave charting into:

  • Global Indices
  • US Stocks & ASX Stocks
  • Forex & Crypto
  • Commodities
Top-Notch Trading Tools

Equip yourself with the tools of success:

  • Real-time Chat rooms
  • Elliott Wave Algorithm
  • Portfolio tools
  • TradingLevels
  • Screener
  • Trading Game
7 Elliott Wave Analysts

Stay ahead of the market with daily charts and insightful videos
Your secret to strategic trading!

JOIN HERE


Welcome to TradingLounge (ASIC A.R.No. 321187), specialists in trades, trading education and technical analysis, covering stocks, indices, commodities, forex and cryptocurrencies.

When you join TradingLounge you have access to everything we offer, including trade tools, educational content and a social platform to chat with like-minded investors.

Read more

@Copyright 2024 by tradinglounge.com

Contact Us

Australian no: 02 4787 6020

International no: +61 (2) 47876020

Pay with:

Find us on