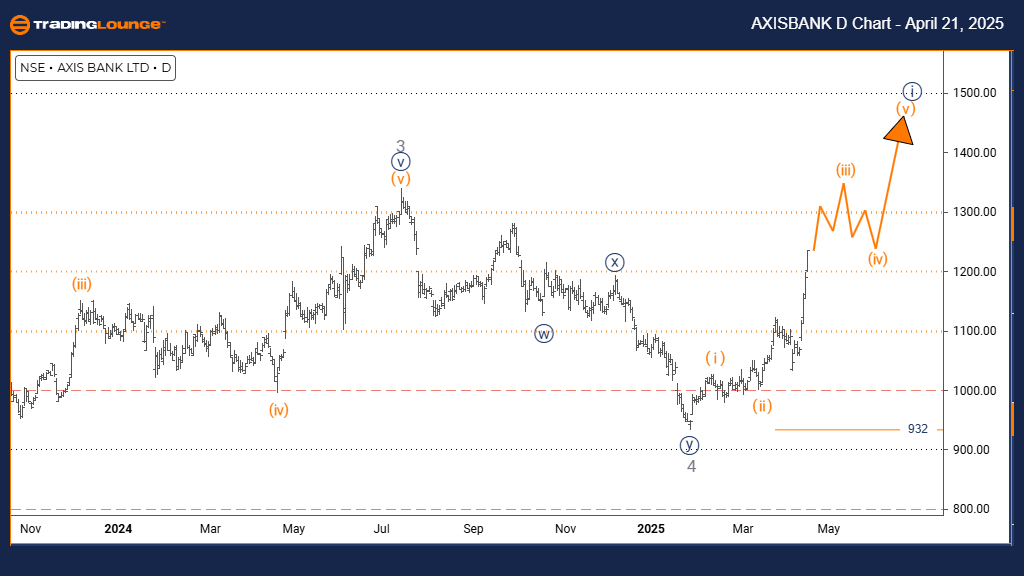
AXIS BANK Elliott Wave Analysis | TradingLounge Daily Chart
AXIS BANK Elliott Wave Technical Forecast
FUNCTION: Bullish Trend
MODE: Impulsive
STRUCTURE: Orange Wave 3
POSITION: Navy Blue Wave 1
NEXT LOWER DEGREE DIRECTION: Orange Wave 4
DETAILS: Orange wave 2 appears complete; orange wave 3 of 1 is actively unfolding.
Invalidation Level: 932
The AXIS BANK daily chart reveals a strong bullish trend within an impulsive Elliott Wave setup. The completion of orange wave 2 has triggered the development of orange wave 3, which is part of a broader navy blue wave 1 structure. This signals the beginning of a powerful upward movement, with the potential for further bullish acceleration.
Wave 3 typically represents the most forceful leg in an Elliott Wave impulse, often extending beyond wave 1 in both strength and length. The breakout from wave 2 has established the foundation for orange wave 3 to gain traction. As momentum builds, this phase could lead to substantial price increases before a temporary retracement in wave 4.
The anticipated next step is orange wave 4, which is expected once wave 3 peaks. This corrective phase could present a strategic entry opportunity for traders seeking to align with the broader uptrend. A move below 932 would invalidate the current bullish wave count and signal the need for a revised analysis.
This daily Elliott Wave outlook suggests that AXIS BANK remains in a favorable bullish setup. Traders should monitor the characteristics of wave 3—namely, impulsive rallies and volume confirmation—while respecting the invalidation level. As wave 1 unfolds at the navy blue degree, the outlook remains positive for sustained upward movement.
To strengthen confidence in the wave pattern, traders should apply supporting tools such as volume analysis and momentum indicators. With the navy blue wave 1 marking the beginning of a higher-degree move, the long-term trend may continue higher, provided the structure remains intact.
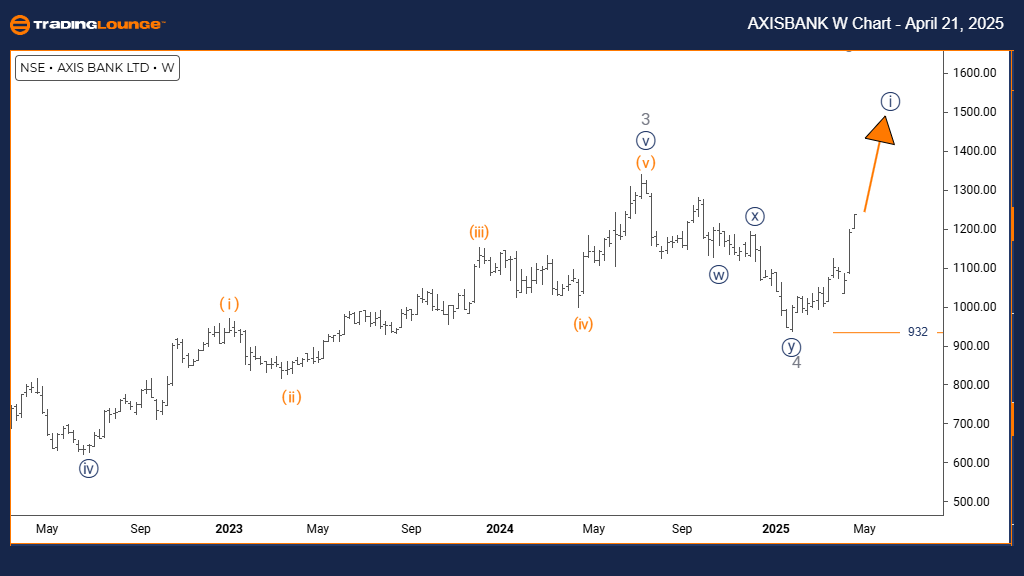
AXIS BANK Elliott Wave Analysis | TradingLounge Weekly Chart
AXIS BANK Weekly Elliott Wave Forecast
FUNCTION: Bullish Trend
MODE: Impulsive
STRUCTURE: Navy Blue Wave 1
POSITION: Gray Wave 5
NEXT LOWER DEGREE DIRECTION: Navy Blue Wave 2
DETAILS: Gray wave 4 is likely complete; navy blue wave 1 of 5 is advancing.
Invalidation Level: 932
On the weekly timeframe, AXIS BANK maintains a bullish Elliott Wave structure, showing an impulsive progression. The stock is in the final stages of a five-wave sequence, with gray wave 5 currently advancing. This leg is part of the broader navy blue wave 1, indicating further gains in the near term before a corrective phase develops.
Gray wave 4 appears to have finalized, suggesting that the prior correction has ended. The current movement, navy blue wave 1 of 5, marks the beginning of a new minor impulse within gray wave 5. This sets the stage for a short-term continuation of the upward trend as the market seeks higher ground.
The invalidation level for this wave structure is 932. Should the price drop below this point, the present count would no longer be valid, and a fresh assessment would be required. Until then, the progression of wave 1 of 5 supports the case for near-term bullish activity.
Looking ahead, the next expected move is navy blue wave 2, which will provide a corrective phase once the current rally matures. Traders should monitor for signs of wave exhaustion and prepare for possible pullbacks within the bullish structure.
In summary, AXIS BANK’s weekly Elliott Wave setup indicates potential short-term upside as part of the ongoing impulse. Staying above the 932 invalidation level keeps the bullish scenario in play, giving traders a technical edge to follow the trend.
Technical Analyst: Malik Awais
Source: visit Tradinglounge.com and learn From the Experts. Join TradingLounge Here
Previous: NIFTY 50 Elliott Wave Technical Analysis
VALUE Offer - Buy 1 Month & Get 3 Months!Click here
Access 7 Analysts Over 200 Markets Covered. Chat Room With Support