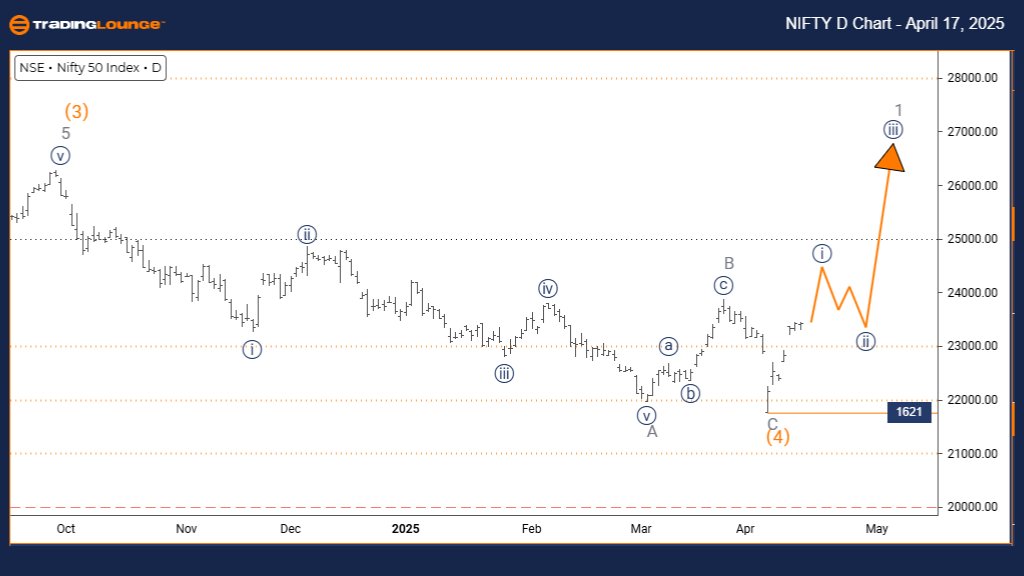
NIFTY 50 INDEX Elliott Wave Analysis | Trading Lounge Daily Chart
NIFTY 50 INDEX Daily Chart Analysis
NIFTY 50 INDEX Elliott Wave Technical Forecast
FUNCTION: Bullish Trend
MODE: Impulsive
STRUCTURE: Navy Blue Wave 1
POSITION: Gray Wave 1
DIRECTION NEXT LOWER DEGREES: Navy Blue Wave 2
DETAILS: Orange Wave 4 appears complete. Navy Blue Wave 1 of Gray Wave 1 is now underway.
Wave Cancel Invalid Level: 1621
The NIFTY 50 Index daily Elliott Wave analysis highlights the early stages of a bullish impulsive wave count. With orange wave 4 showing signs of completion, the focus shifts to navy blue wave 1, unfolding within the larger structure of gray wave 1. This signals the beginning of a potential upward Elliott Wave cycle, aligning with growing market momentum.
Navy blue wave 1 typically signals the onset of a new trend phase. While this wave often shows moderate gains, it lays the groundwork for stronger moves in subsequent waves. This initial impulsive structure supports a building bullish sentiment in the NIFTY 50, suggesting further price advances before encountering a corrective phase.
Following the completion of wave 1, navy blue wave 2 is expected to emerge as a corrective retracement. Traders may find this phase offers pullback opportunities before wave 3 resumes the uptrend. The invalid wave level at 1621 acts as a critical support marker. A drop below this would invalidate the current bullish count and prompt a reevaluation.
From a daily perspective, this wave setup presents a key window for identifying early entries in bullish trade setups. Watch for traditional wave 1 characteristics—rising volume, steady gains, and breakout formations—as confirmation of the wave's progression.
The transition into gray wave 1 on a higher degree underscores the potential for extended bullish follow-through. Traders and investors should closely monitor momentum indicators and price action to validate the current structure and anticipate the onset of wave 2 within this impulsive advance.
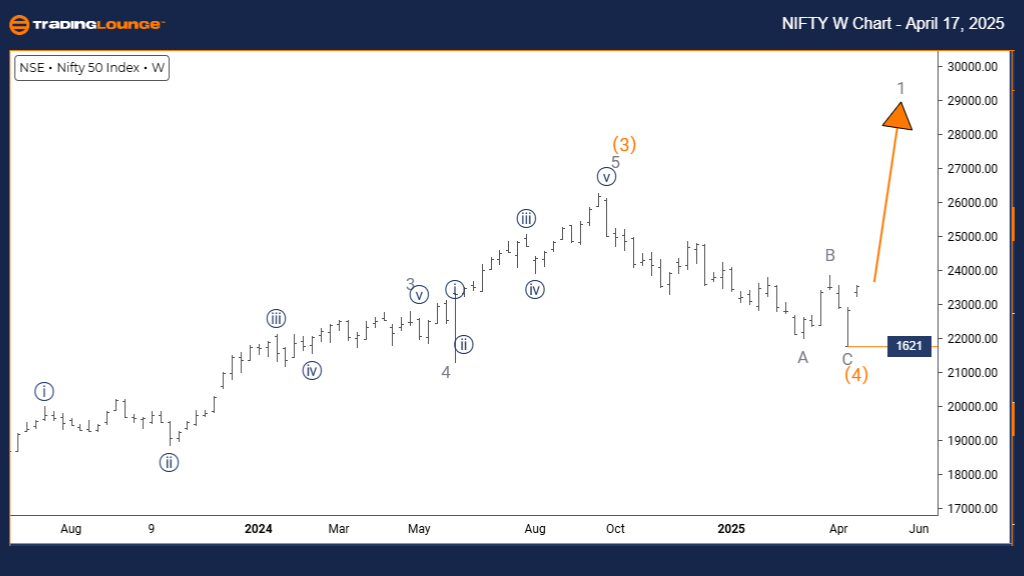
NIFTY 50 INDEX Elliott Wave Analysis | Trading Lounge Weekly Chart
NIFTY 50 INDEX Elliott Wave Technical Forecast
FUNCTION: Bullish Trend
MODE: Impulsive
STRUCTURE: Gray Wave 1
POSITION: Orange Wave 5
DIRECTION NEXT LOWER DEGREES: Gray Wave 1 (Started)
DETAILS: Orange Wave 4 appears completed. Gray Wave 1 of 5 is currently unfolding.
Wave Cancel Invalid Level: 1621
The weekly Elliott Wave analysis for NIFTY 50 reflects a developing bullish trend within a classic impulsive wave sequence. With orange wave 4 completing, the index is now progressing through gray wave 1, initiating the final leg of orange wave 5. This structure suggests a maturing uptrend with the potential for one last rally before a larger correction.
As gray wave 1 unfolds, it marks the beginning of what may be the final bullish leg in the current cycle. This wave often builds gradually, lifting prices and setting the stage for wave 5 to reach maturity. The structure supports further upside in the near term, especially as the impulsive wave gains traction.
The weekly timeframe provides strategic insight for medium- to long-term traders, with orange wave 5 signaling a possible peak formation. This phase could represent a final buying opportunity before a significant trend reversal. Momentum indicators should be used to detect weakening strength as the wave matures.
Key technical support sits at 1621, serving as the wave invalidation level. A break below this point would void the current count and suggest a reassessment of the bullish structure. Until then, the uptrend remains intact and offers attractive setups for intermediate-term trading strategies.
Overall, this Elliott Wave setup reinforces a bullish outlook while highlighting the importance of timing and structure awareness. Look for early warning signs of wave completion such as bearish divergences or topping patterns. This final impulsive wave leg provides a crucial phase for active market participants aiming to align their positions with the broader Elliott Wave roadmap.
Technical Analyst: Malik Awais
Source: visit Tradinglounge.com and learn From the Experts. Join TradingLounge Here
Previous: LARSEN & TOUBRO Elliott Wave Technical Analysis
VALUE Offer - Buy 1 Month & Get 3 Months!Click here
Access 7 Analysts Over 200 Markets Covered. Chat Room With Support