GBPUSD Elliott Wave Analysis – Trading Lounge Day Chart

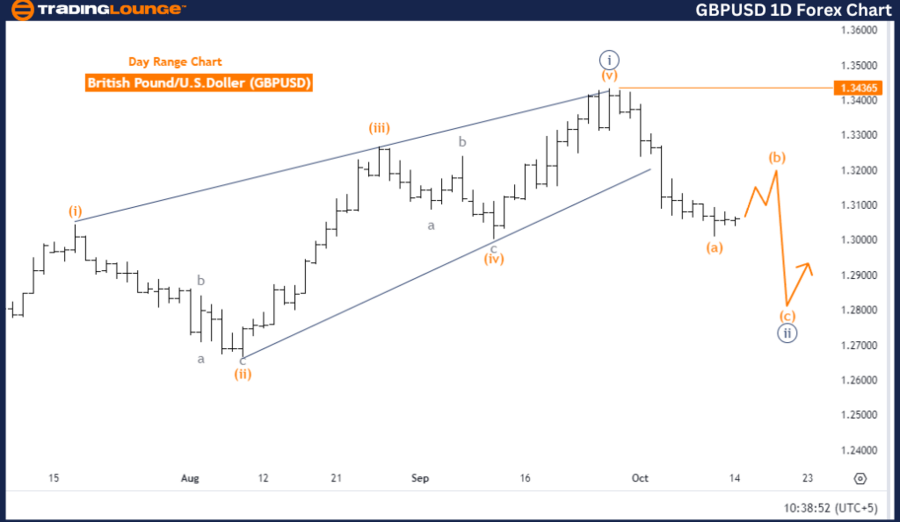
British Pound/US Dollar (GBPUSD) – Daily Chart Overview

GBPUSD Elliott Wave Technical Analysis

Function: Counter Trend

Mode: Corrective

Structure: Navy Blue Wave 2

Position: Gray Wave 3

Direction (Next Higher Degree): Navy Blue Wave 3

Details: Navy Blue Wave 1 completed, Navy Blue Wave 2 unfolding

Wave Cancel Invalid Level: 1.34365

Analysis Overview

The daily Elliott Wave analysis of GBPUSD reveals that the currency pair is undergoing a corrective counter-trend phase, marked by navy blue wave 2. This correction follows the completion of Navy Blue Wave 1, indicating that the market is in a retracement stage before continuing the larger upward trend.

Wave Structure & Position

  • Gray wave 3 is part of the corrective structure in progress.

  • Once Navy Blue Wave 2 finishes, the market is expected to transition into navy blue wave 3, resuming the upward trend.

Key Details

  • Navy blue wave 1 has completed, and the current phase represents navy blue wave 2.

  • This corrective structure will remain valid until the transition to the next impulsive wave (navy blue wave 3).
  • Wave Cancel Invalid Level: If GBPUSD trades above 1.34365, the existing wave count will be invalid, requiring a new analysis.

Summary

GBPUSD is presently navigating navy blue wave 2, a corrective phase following wave 1. The broader trend is expected to resume with the development of navy blue wave 3 once this correction concludes. This analysis holds as long as GBPUSD remains below the invalidation level of 1.34365.

GBPUSD-1D-Forex-Char...


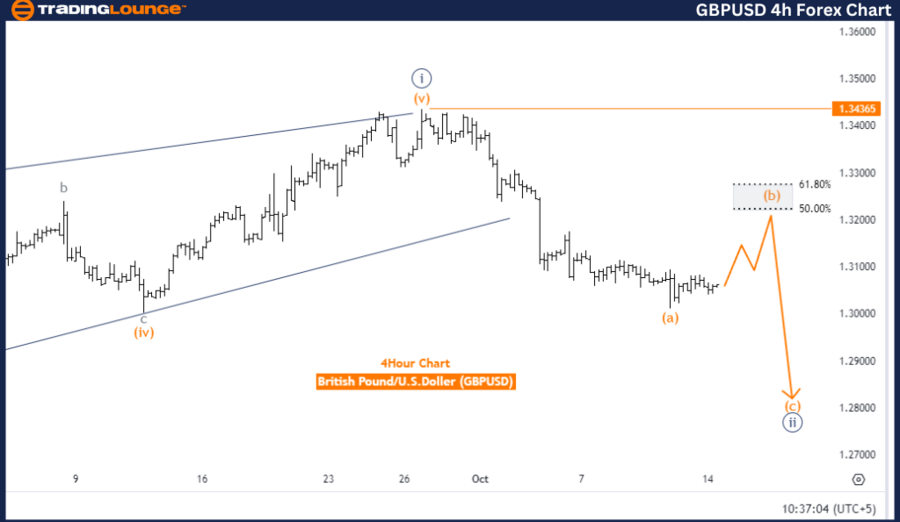
British Pound/US Dollar (GBPUSD) – 4-Hour Chart Overview

GBPUSD Elliott Wave Technical Analysis

Function: Counter Trend

Mode: Corrective

Structure: Orange Wave B

Position: Navy Blue Wave 2

Direction (Next Lower Degree): Orange Wave C

Details: Orange Wave A of 2 completed, Orange Wave B of 2 currently developing

Wave Cancel Invalid Level: 1.34365

Analysis Overview

The 4-hour Elliott Wave analysis indicates that GBPUSD is in a corrective phase, currently forming orange wave B within navy blue wave 2. The market remains in the broader corrective structure initiated by the previous orange wave A.

Wave Structure & Position

  • After the completion of orange wave B, the next anticipated move is orange wave C.

  • This sequence reflects a continuation of the correction within navy blue wave 2.

Key Details

  • Orange wave A has finished, and orange wave B is currently in progress.

  • This corrective phase suggests a temporary pullback before the market resumes its next move.

  • Wave Cancel Invalid Level: If GBPUSD surpasses 1.34365, the current wave count will be invalidated, requiring fresh analysis.

Summary

In the 4-hour time frame, GBPUSD is progressing through orange wave B, part of the larger navy blue wave 2 correction. Once wave B completes, the market is expected to enter orange wave C, extending the correction. The wave structure remains valid unless GBPUSD breaks above 1.34365.

Technical Analyst: Malik Awais

Source: visit Tradinglounge.com and learn From the Experts Join TradingLounge Here 

Previous: U.S. Dollar / Japanese Yen (USDJPY) Elliott Wave Technical Analysis

VALUE Offer - Buy 1 Month & Get 3 Months!Click here

Access 7 Analysts Over 200 Markets Covered. Chat Room With Support

GBPUSD-4h-Forex-Char...

Related

Silver XAGUSD Commodity Elliott Wave Technical Analysis: Covers Market Trends, and Offers Strategic Insights

Silver XAGUSD Commodity Elliott Wave Technical Analysis: Covers Market Trends, and Offers Strategic Insights

This article provides an in-depth Silver Elliott Wave analysis, predicting potential price movements...

Read More >
Amazon Inc. (AMZN) Elliott Wave Analysis: Amazon Stock Forecast, Market Trends, Trading Strategies, and Investment Insights

Amazon Inc. (AMZN) Elliott Wave Analysis: Amazon Stock Forecast, Market Trends, Trading Strategies, and Investment Insights

Elliott Wave analysis of Amazon (AMZN) stock, including insights into current market trends, wave pa...

Read More >
NASDAQ Elliott Wave Analysis: Stock Market Trends, Impulse Wave Forecast, Trading Strategies, and Key Resistance & Support Levels

NASDAQ Elliott Wave Analysis: Stock Market Trends, Impulse Wave Forecast, Trading Strategies, and Key Resistance & Support Levels

NASDAQ Elliott Wave Analysis, covering technical indicators, price movements, and market trends. Lea...

Read More >
Explore the current Bitcoin Crypto Price trends Today Elliott Wave Technical Analysis to make informed decisions

Explore the current Bitcoin Crypto Price trends Today Elliott Wave Technical Analysis to make informed decisions

In this article, we provide a detailed BTCUSD Elliott Wave analysis focusing on Bitcoin price trends...

Read More >
Unleash Profits: Elliott Wave Analysis & Strategies for SP500, NASDAQ 100, RUSSELL 2000, DAX 40, FTSE 100, ASX 200

Unleash Profits: Elliott Wave Analysis & Strategies for SP500, NASDAQ 100, RUSSELL 2000, DAX 40, FTSE 100, ASX 200

Stock Market Indices Overview: S&P 500, SPY, NASDAQ 100, QQQ, RUSSELL 2000, DAX 40, FTSE 100, ASX 20...

Read More >
NEO/USD Crypto Price News Today Elliott Wave Technical Analysis: Wave 3 Rally Insights and Trading Strategies

NEO/USD Crypto Price News Today Elliott Wave Technical Analysis: Wave 3 Rally Insights and Trading Strategies

This article delves into Elliott Wave analysis for NEO/USD, focusing on the conclusion of Wave 2 and...

Read More >

$1 for 2 Weeks

then $29 a month!

What a Special Offer!

Trade Recommendations

Unleash the power of deversified trading with our comprehensive portfolio, covering 250+ markets:

  • Stock Trades
  • Crypto Trades
  • Forex Trades
  • Commodity Trades
Elliott Wave Analysis

Gain a competitive edge with expert insights and AI-powered Elliott Wave charting into:

  • Global Indices
  • US Stocks & ASX Stocks
  • Forex & Crypto
  • Commodities
Top-Notch Trading Tools

Equip yourself with the tools of success:

  • Real-time Chat rooms
  • Elliott Wave Algorithm
  • Portfolio tools
  • TradingLevels
  • Screener
  • Trading Game
7 Elliott Wave Analysts

Stay ahead of the market with daily charts and insightful videos
Your secret to strategic trading!

JOIN HERE


Welcome to TradingLounge (ASIC A.R.No. 321187), specialists in trades, trading education and technical analysis, covering stocks, indices, commodities, forex and cryptocurrencies.

When you join TradingLounge you have access to everything we offer, including trade tools, educational content and a social platform to chat with like-minded investors.

Read more

@Copyright 2024 by tradinglounge.com

Contact Us

Australian no: 02 4787 6020

International no: +61 (2) 47876020

Pay with:

Find us on