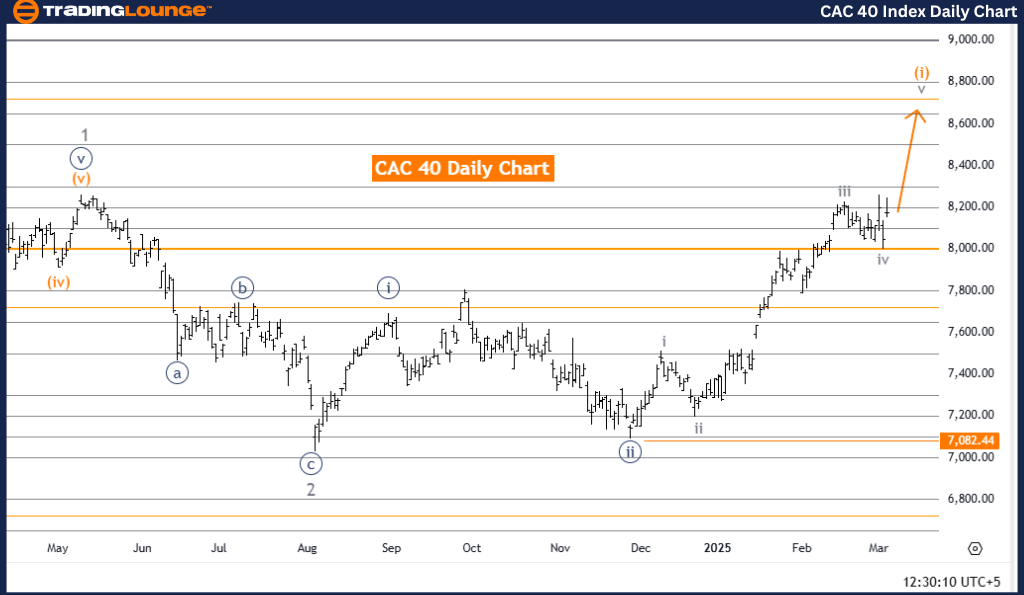
CAC 40 (France) Elliott Wave Analysis - Trading Lounge Day Chart
CAC 40 (France) Wave Technical Analysis
Technical Analysis Overview
Function: Bullish Trend
Mode: Impulsive
Structure: Gray Wave 3
Position: Orange Wave 1
Next Lower Degree Direction: Orange Wave 2
Wave Cancel Invalidation Level: 7,082.44
Analysis Overview
The CAC 40 Elliott Wave Analysis on the daily chart confirms a bullish trend, with the index currently in an impulsive phase. The wave pattern is identified as Gray Wave 3, which forms part of a larger upward movement within Orange Wave 1. This setup suggests strong market momentum, consistent with impulsive wave structures. The next anticipated movement in a lower degree is Orange Wave 2, which is expected to emerge after Gray Wave 3 completes.
The analysis indicates that Gray Wave 4 is likely completed, and the market is advancing through Gray Wave 5 of Orange Wave 1. This phase is expected to carry strong bullish momentum, aligning with the impulsive trend structure. Traders should monitor the development of Gray Wave 5, as its completion could trigger Orange Wave 2, a potential corrective pullback before the larger uptrend resumes.
A key technical level to monitor is the wave cancelation invalidation level at 7,082.44. If the price drops below this threshold, it would invalidate the current wave count, requiring a market structure reassessment. This level serves as a critical support zone, and a breakdown below it could indicate a potential trend reversal or wave structure adjustment.
Conclusion
The CAC 40 remains bullish, with Gray Wave 5 in progress after the completion of Gray Wave 4. This impulsive movement is a key part of Orange Wave 1, with Orange Wave 2 anticipated next. Traders should closely observe the completion of Gray Wave 5, as it will offer insights into the timing and direction of the next corrective phase. Understanding Elliott Wave structures is essential for traders to anticipate potential price movements and align their trading strategies accordingly.
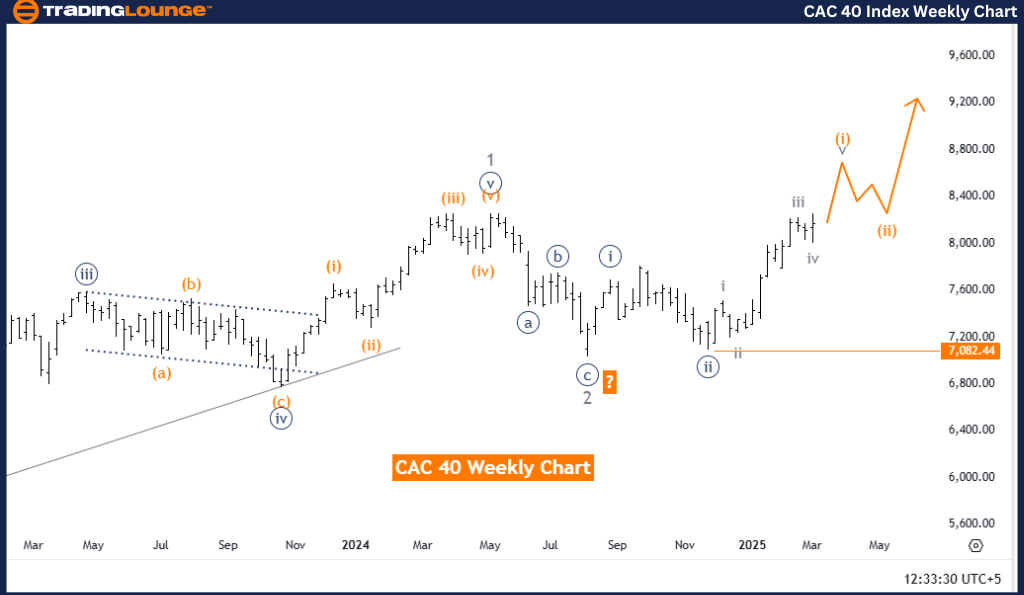
CAC 40 (France) Elliott Wave Analysis - Trading Lounge Weekly Chart
CAC 40 (France) Wave Technical Analysis
Technical Analysis Overview
Function: Bullish Trend
Mode: Impulsive
Structure: Orange Wave 1
Position: Navy Blue Wave 3
Next Lower Degree Direction: Orange Wave 2
Wave Cancel Invalidation Level: 7,082.44
Analysis Overview
The CAC 40 Elliott Wave Analysis for the weekly chart highlights a bullish trend, with the index in an impulsive phase. The current wave structure is Orange Wave 1, which forms part of the broader Navy Blue Wave 3. This pattern indicates a strong upward trend, characteristic of impulsive wave formations. The next expected lower-degree wave is Orange Wave 2, projected to unfold after Orange Wave 1 completes.
The analysis suggests that Navy Blue Wave 2 has likely completed, and the market is now progressing through Orange Wave 1 of 3. This phase is expected to exhibit strong bullish momentum, consistent with an impulsive trend. Traders should keep an eye on Orange Wave 1's development, as its completion may trigger Orange Wave 2, which could introduce a temporary pullback or consolidation phase before the primary uptrend resumes.
A critical support level to watch is the wave cancellation invalidation level at 7,082.44. If the price moves below this threshold, it would invalidate the current wave count, necessitating a reevaluation of the market structure. This level functions as a major technical support, and a break below it may signal a trend shift or potential wave structure adjustment.
Conclusion
The CAC 40 remains in a bullish uptrend, with Orange Wave 1 in progress after the completion of Navy Blue Wave 2. This impulsive movement is an essential component of Navy Blue Wave 3, with Orange Wave 2 expected next. Traders should closely track Orange Wave 1’s completion, as it will provide valuable insight into the next wave cycle. Understanding the Elliott Wave framework is crucial for traders seeking to predict price movements and optimize trading strategies effectively.
Technical Analyst: Malik Awais
Source: visit Tradinglounge.com and learn From the Experts Join TradingLounge Here
Previous: Hang Seng Index Elliott Wave Technical Analysis
VALUE Offer - Buy 1 Month & Get 3 Months!Click here
Access 7 Analysts Over 200 Markets Covered. Chat Room With Support