HERO MOTO CORP – HERO (1D Chart) Elliott Wave Technical Analysis
Hero Motocorp Daily Chart Technical Analysis
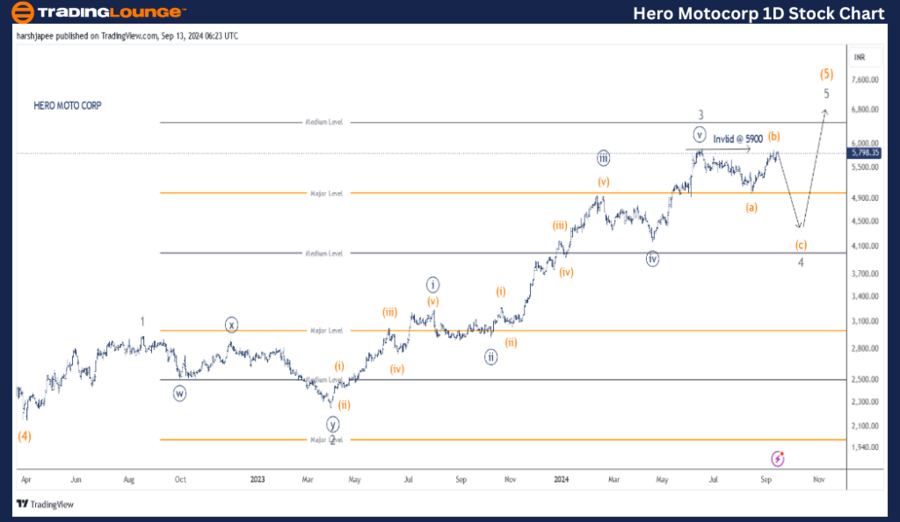
Function: Counter Trend (Minor degree Wave 4, Grey)
Mode: Corrective
Structure: Flat
Position: Wave (b) orange
Details: Minor Wave 4 Grey, unfolding as a Flat, against 5900.
Invalidation point: 5900
HERO Elliott Wave Technical Analysis and Potential Elliott Wave Counts:
The Hero Motocorp daily chart suggests an ongoing progressive rally, unfolding as Intermediate Wave (5) Orange at a larger degree, with the potential to breach the 6500 mark. As of now, Minor Wave 3 Grey seems to have completed near the 5900 level, with a corrective phase currently underway.
Hero Motocorp had concluded its Intermediate Wave (4) Orange around the 2150 lows in March 2022. Since then, the stock has rallied toward the 5900 highs, subdividing into Minor Waves 1 through 3 Grey, as shown in the chart.
If the current wave structure holds, the stock is expected to experience a corrective move at the Minor degree, which will terminate Wave 4 Grey before resuming the final rally towards the 6500 mark. Traders may still consider holding long positions, as the rally appears incomplete.
HERO MOTO CORP (4H Chart)– HERO Elliott Wave Analysis
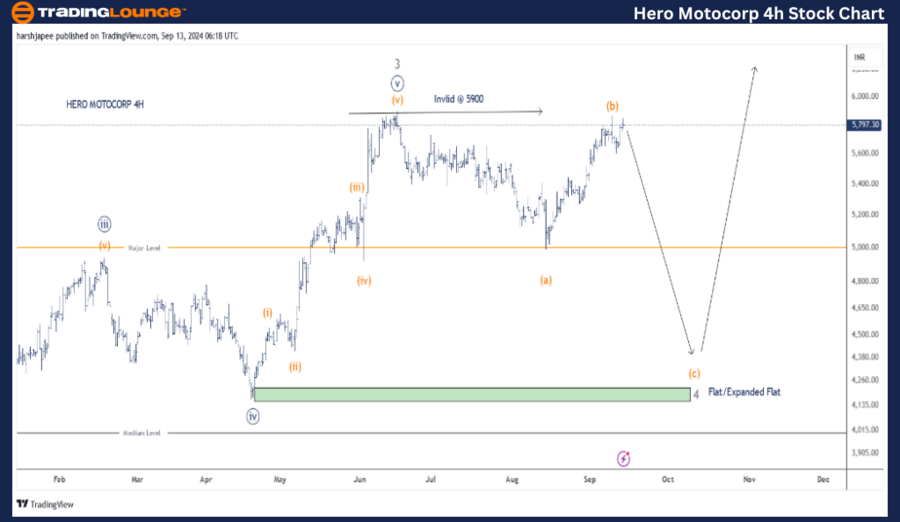
Function: Counter Trend (Minor degree Wave 4, Grey)
Mode: Corrective
Structure: Flat
Position: Wave (b) orange
Details: Minor Wave 4 Grey, unfolding as a Flat, against 5900. A slight push above 5900 would maintain the corrective wave structure, suggesting a potential expanded flat.
Invalidation point: 5900
Hero Motocorp 4H Chart Technical Analysis and Potential Elliott Wave Counts:
The Hero Motocorp 4H chart focuses on the subwaves between Minute Wave ((iv)) and ((v)) Navy. As the rally is impulsive, these subwaves have been labeled as Minuette Waves (i) through (v) Orange between the 4175 and 5900 levels.
If Minor Wave 3 Grey is confirmed complete around the 5900 mark, a corrective wave, Minuette Wave (a)-(b)-(c) Orange, is now unfolding against the recent high. There is also potential for a triangle or expanded flat structure to develop before Minor Wave 4 terminates.
Technical Analyst: Harsh Japee
Source: visit Tradinglounge.com and learn From the Experts Join TradingLounge Here
Previous: TATA Motors India Elliott Wave Technical Analysis
Special Trial Offer - 0.76 Cents a Day for 3 Months! Click here
Access 7 Analysts Over 200 Markets Covered. Chat Room With Support
Conclusion:
Hero Motocorp is undergoing a corrective move lower towards the 4200-4500 zone, which aligns with previous Wave ((iv)) Navy of one lesser degree, to complete Minor Wave 4 Grey.