23Jun

USDCHF Elliott Wave Forecast Reveals Bullish Daily Trend and Corrective 4-Hour Phase with Key Invalidation Level at 0.84823

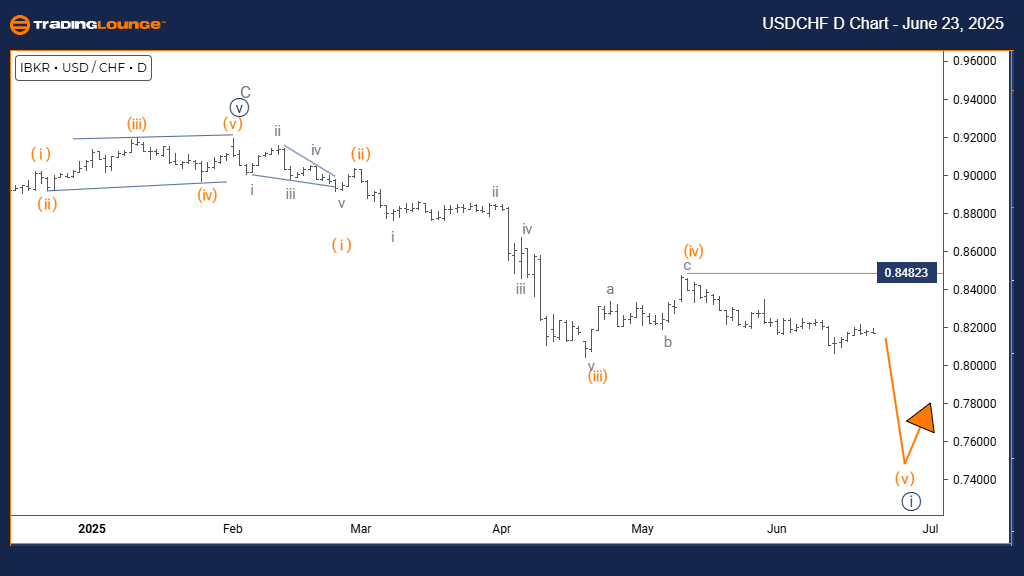
USDCHF Elliott Wave Analysis – Trading Lounge Day Chart

U.S. Dollar / Swiss Franc (USDCHF) Day Chart Analysis

USDCHF Elliott Wave Technical Analysis

FUNCTION: Bullish Trend

MODE: Impulsive

STRUCTURE: Navy Blue Wave 1

POSITION: Gray Wave 1

DIRECTION NEXT LOWER DEGREES: Navy Blue Wave 2

DETAILS: Navy Blue Wave 1 of Gray Wave 1 is currently developing

CANCEL INVALID LEVEL: 0.84823

The USDCHF daily chart reflects a strong bullish Elliott Wave structure, highlighting an impulsive move that indicates sustained buying momentum. Presently, the price is advancing in Navy Blue Wave 1, nested within the broader Gray Wave 1, marking the potential early stages of a prolonged upward trend.

As Navy Blue Wave 1 continues to build, it supports the hypothesis of a new uptrend emerging. Following the completion of this wave, a corrective pullback in Navy Blue Wave 2 is likely, serving as a consolidation phase before upward momentum resumes.

The key invalidation level is 0.84823. A price break below this point would nullify the current bullish wave count, warranting a revised outlook. However, as long as this level is respected, the bullish scenario remains intact, indicating more room for upside.

From a technical viewpoint, USDCHF appears poised for continued gains. The strength of Navy Blue Wave 1 underscores active buyer participation and signals a favorable long-term trend structure.

USDCHF-D-Forex-Chart...


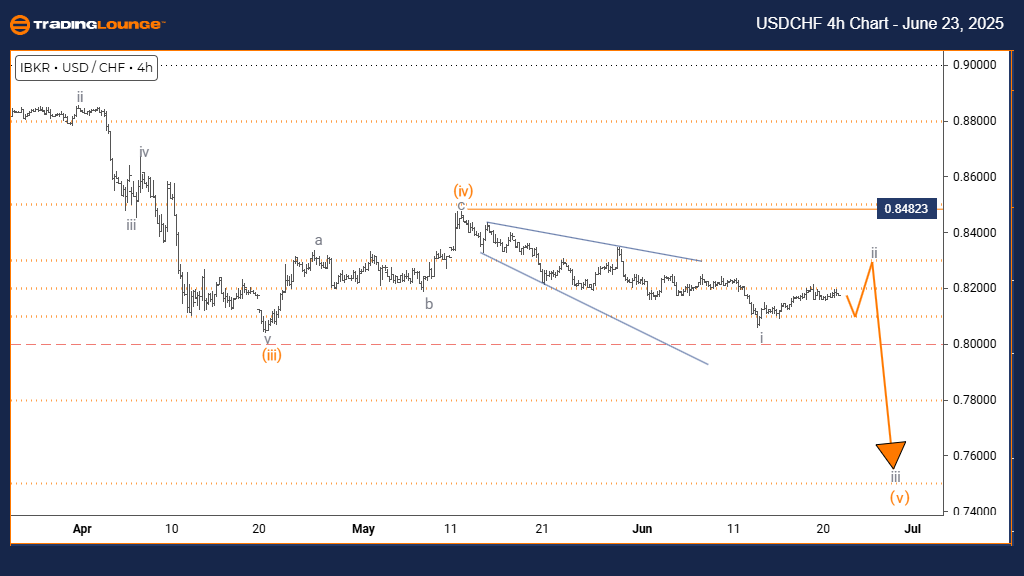
U.S. Dollar / Swiss Franc (USDCHF) 4-Hour Chart Analysis

USDCHF Elliott Wave Technical Analysis

FUNCTION: Counter Trend

MODE: Corrective

STRUCTURE: Gray Wave 2

POSITION: Orange Wave 5

DIRECTION NEXT LOWER DEGREES: Gray Wave 3

DETAILS: Gray Wave 1 is complete; Gray Wave 2 is unfolding

CANCEL INVALID LEVEL: 0.84823

On the 4-hour timeframe, USDCHF is in a corrective Elliott Wave phase, reflecting a counter-trend pattern. The active Gray Wave 2, nested within Orange Wave 5, suggests a temporary retracement in the context of an ongoing larger bullish cycle.

Having completed Gray Wave 1, the pair is now progressing through Gray Wave 2, a typical correction that precedes the continuation of the major trend. Once this wave concludes, Gray Wave 3 is anticipated to start, potentially pushing the price higher in alignment with the dominant trend.

The analysis becomes invalid if USDCHF drops below 0.84823. This critical support acts as a validation point for the current structure. As long as it holds, the corrective pattern remains active, with an eventual upside breakout expected.

Technically, the market may exhibit sideways action or mild retracements while Gray Wave 2 plays out. Traders should watch closely for signs of this wave’s completion as a potential setup for the initiation of Gray Wave 3.

Technical Analyst: Malik Awais

Source: Visit Tradinglounge.com and learn from the Experts. Join TradingLounge Here

Previous: NZDUSD Elliott Wave Technical Analysis

VALUE Offer - $1 for 2 Weeks then $29 a month!Click here

Access 7 Analysts Over 200 Markets Covered. Chat Room With Support

USDCHF-4h-Forex-Char...

Related

Unlocking ASX Trading Success: Santos Limited (STO) Stock Analysis & Elliott Wave Technical Forecast

Unlocking ASX Trading Success: Santos Limited (STO) Stock Analysis & Elliott Wave Technical Forecast

Dive into the ASX market with Santos Limited (STO) stock analysis and Elliott Wave forecast. Stay ah...

Read More >
Discover Commodity market trends with Our Coffee Elliott Wave Technical Analysis and Chart Insights

Discover Commodity market trends with Our Coffee Elliott Wave Technical Analysis and Chart Insights

Stay informed with our detailed coffee price analysis using Elliott Wave theory. Discover market tre...

Read More >
Corn Commodity Elliott Wave Technical Analysis: Delves into the current price movements, forecasts, and trading strategies

Corn Commodity Elliott Wave Technical Analysis: Delves into the current price movements, forecasts, and trading strategies

This article provides a detailed Elliott Wave analysis of the corn market as of 2024. It delves into...

Read More >
Alphabet Inc. (GOOGL) Stock Prediction: GOOGL Elliott Wave Technical Analysis, Price Target, and Trading Strategy

Alphabet Inc. (GOOGL) Stock Prediction: GOOGL Elliott Wave Technical Analysis, Price Target, and Trading Strategy

In this detailed analysis of Alphabet Inc (GOOGL) stock, we apply Elliott Wave Theory to examine pri...

Read More >
Elliott Wave Analysis: NASDAQ Tech Stocks & Bitcoin | SPX, NDX, AAPL, TSLA, NVDA

Elliott Wave Analysis: NASDAQ Tech Stocks & Bitcoin | SPX, NDX, AAPL, TSLA, NVDA

The majority of indices and top tech stocks are concluding Minor Wave 4 corrections, setting up for ...

Read More >

$1 for 2 Weeks

then $29 a month!

What a Special Offer!

Trade Recommendations

Unleash the power of deversified trading with our comprehensive portfolio, covering 250+ markets:

  • Stock Trades
  • Crypto Trades
  • Forex Trades
  • Commodity Trades
Elliott Wave Analysis

Gain a competitive edge with expert insights and AI-powered Elliott Wave charting into:

  • Global Indices
  • US Stocks & ASX Stocks
  • Forex & Crypto
  • Commodities
Top-Notch Trading Tools

Equip yourself with the tools of success:

  • Real-time Chat rooms
  • Elliott Wave Algorithm
  • Portfolio tools
  • TradingLevels
  • Screener
  • Trading Game
7 Elliott Wave Analysts

Stay ahead of the market with daily charts and insightful videos
Your secret to strategic trading!

JOIN HERE


Welcome to TradingLounge (ASIC A.R.No. 321187), specialists in trades, trading education and technical analysis, covering stocks, indices, commodities, forex and cryptocurrencies.

When you join TradingLounge you have access to everything we offer, including trade tools, educational content and a social platform to chat with like-minded investors.

Read more

@Copyright 2024 by tradinglounge.com

Contact Us

Australian no: 02 4787 6020

International no: +61 (2) 47876020

Pay with:

Find us on