Trading Lounge Commodity Insight: Coffee Elliott Wave Analysis

Function: Counter-Trend

Mode: Correction

Structure: Double Zigzag for blue Y

Position: Wave C of (B)

Direction: Wave C of (B) is still in progress

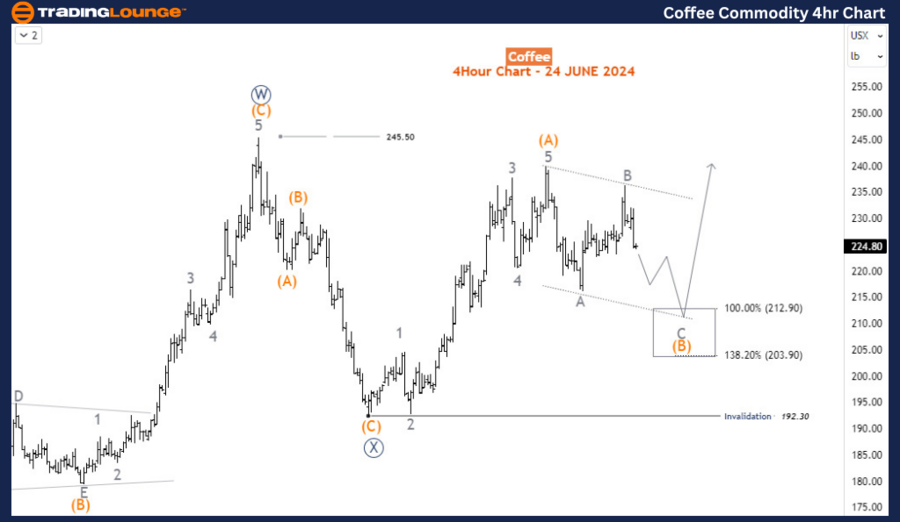
Details: Coffee has been recounted on all time frames. We expect an upward movement after completing the zigzag wave (B) around the Fibonacci reversal zone of 212.9-203.9. The invalidation level is at 192.30.

Coffee Elliott Wave Technical Analysis

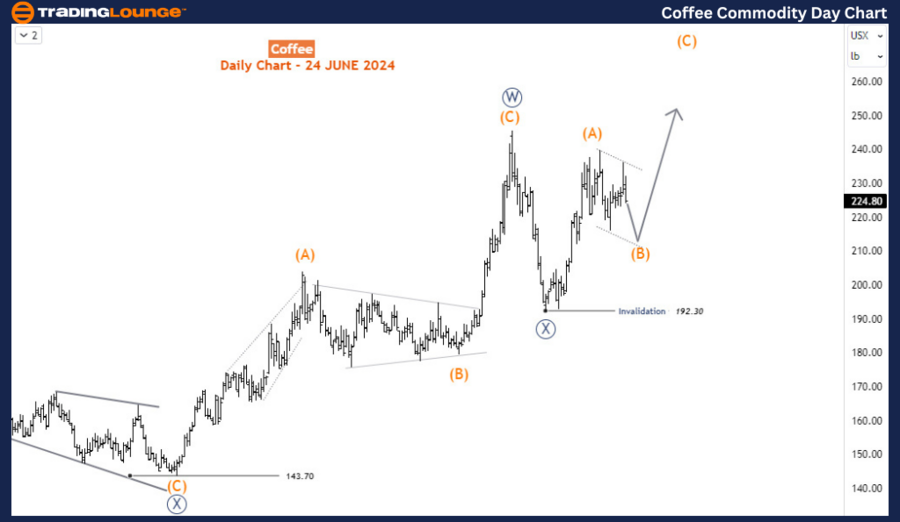
Overview: Long-term Coffee prices have been bullish since October 2023. Despite several pullbacks, each previous top has been consistently breached. The last top was made in April 2024 at 245.5, followed by a decline to 192.3 within three weeks, extending to May 7th. Notable recoveries started from there. However, prices have yet to breach 245.5 to confirm the continuation of the bullish sequence from October 2023.

Daily Chart Analysis:

Since January 2023, a double zigzag structure has been unfolding. Wave W (circled) finished on April 18th at 245.5, and the corresponding wave X (circled) was completed at 192.3 on May 7th, where wave Y (circled) began. Wave (A) of Y appears to have concluded with the impulse surge to the current peak in June 2024. Prices are now correcting into wave (B). If wave (B) completes above 192.3, buyers should gain the advantage to push prices higher, especially above the 245.5 top.
Coffee-Commodity-Day...


H4 Chart Analysis:

On the H4 chart, wave (B) is subdividing into a zigzag structure, potentially completing around the 212.9-203.9 Fibonacci zone before turning upside in wave (C) above 245.5. Alternatively, prices might move sideways between the 245.5 and 192.3 extremes, suggesting a triangle structure for wave X (circled).

Summary: In conclusion, Coffee prices remain bullish with potential for further gains, contingent on the completion of the current corrective wave (B).

Technical Analyst: Sanmi Adeagbo

Source: visit Tradinglounge.com and learn From the Experts Join TradingLounge Here 

See Previous: Gold Elliott Wave Technical Analysis

Special Trial Offer - 0.76 Cents a Day for 3 Months! Click here

Access 7 Analysts Over 170 Markets Covered. Chat Room With Support
Coffee-Commodity-4hr...

Related

Unlocking Market Potential: SP500 at 5000 and Nasdaq 100 at 18000 Resistances - Elliott Wave Analysis Update

Unlocking Market Potential: SP500 at 5000 and Nasdaq 100 at 18000 Resistances - Elliott Wave Analysis Update

SP500 at 5000, Nasdaq 100 near 18000 resistance. Markets may temporarily breach, but gravitational p...

Read More >
Learn about Ethereum's Crypto Price uptrend and downtrend indicators: ETHUSD Elliott Wave Technical Analysis

Learn about Ethereum's Crypto Price uptrend and downtrend indicators: ETHUSD Elliott Wave Technical Analysis

This analysis provides a detailed overview of Ethereum price prediction using Elliott Wave Theory. I...

Read More >
Australian Dollar/U.S.Dollar (AUDUSD) Elliott Wave Technical Analysis 15 December 23

Australian Dollar/U.S.Dollar (AUDUSD) Elliott Wave Technical Analysis 15 December 23

AUDUSD Elliott Wave Analysis Trading Lounge Day Chart dated 15 December 23, provides a detailed anal...

Read More >
Silver (XAGUSD) Commodity Elliott Wave Analysis: Key Trading Opportunities and Technical Insights that Could Influence Silver Prices

Silver (XAGUSD) Commodity Elliott Wave Analysis: Key Trading Opportunities and Technical Insights that Could Influence Silver Prices

This article provides an in-depth Silver Elliott Wave analysis with a detailed price forecast for 20...

Read More >
Australian Dollar / Japanese Yen(AUDJPY) Elliott Wave Technical Analysis 14 November 23

Australian Dollar / Japanese Yen(AUDJPY) Elliott Wave Technical Analysis 14 November 23

Australian Dollar / Japanese Yen(AUDJPY) Elliott Wave Technical Analysis 14 November 23, In summary,...

Read More >
U.S. Dollar / Swiss Franc Forex Currency Pair is Currently in a Corrective Phase - USDCHF Elliott Wave Technical Analysis

U.S. Dollar / Swiss Franc Forex Currency Pair is Currently in a Corrective Phase - USDCHF Elliott Wave Technical Analysis

According to Elliott Wave analysis, the USDCHF is currently in a corrective phase. Orange Wave 2 is ...

Read More >

Buy 1 Month

Get 3 Months!

Special Offer:

Trade Recommendations

Unleash the power of deversified trading with our comprehensive portfolio, covering:

  • Stock Trades
  • Crypto Trades
  • Forex Trades
  • Commodity Trades
Elliott Wave Analysis

Gain a competive edge with expert insights in to:

  • Global Indices
  • US Stocks & ASX Stocks
  • Forex & Crypto
  • Commodities
Top-Notch Trading Tools

Equip yourself with the tools of success:

  • Social Chat
  • Elliott Wave Algorithm
  • Screener
  • TradingLevels
  • Trading Game
7 Elliott Wave Analysts

Stay ahead of the market with daily charts and insightful videos
-Your secret to strategic trading!

JOIN HERE


Welcome to TradingLounge (ASIC A.R.No. 321187), specialists in trades, trading education and technical analysis, covering stocks, indices, commodities, forex and cryptocurrencies.

When you join TradingLounge you have access to everything we offer, including trade tools, educational content and a social platform to chat with like-minded investors.

Read more

@Copyright 2024 by tradinglounge.com

Contact Us

Australian no: 02 4787 6020

International no: +61 (2) 47876020

Pay with:

Find us on