Gold Elliott Wave Analysis

Function: Counter-Trend

Mode: Corrective

Structure: Likely Double Zigzag

Position: Wave 4

Direction: Wave 4 is still in play

Details: Gold count adjusted to fit the sideways structure emerging for wave 4. The structure still supports further rallies.

Gold has remained in a sideways range since the decline on April 12th, 2024. Despite this consolidation, the metal is poised for more gains and potentially a fresh all-time high. Gold is in a long-term bullish trend, with no significant bearish correction expected until the impulse cycle from September 2023 completes.

Daily Chart Analysis

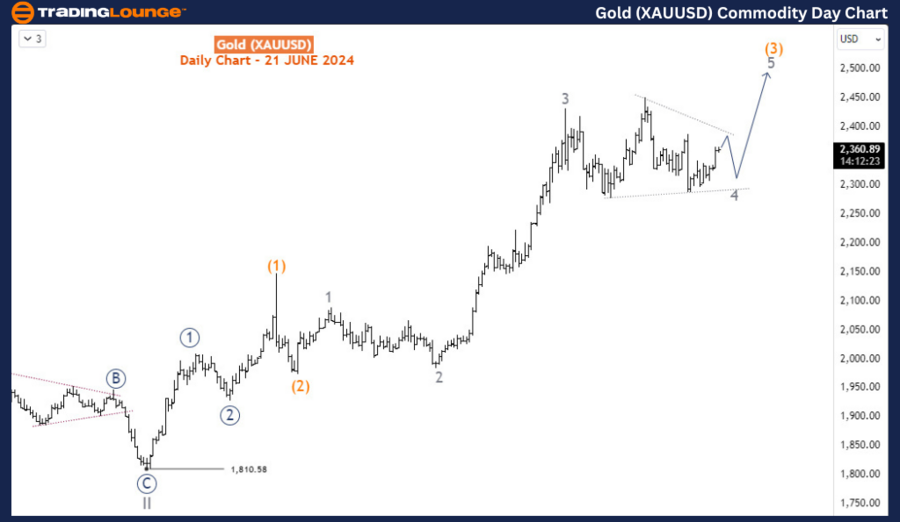
Gold prices have been largely bullish, with a cycle degree impulse wave III emerging from 1810.5 in September 2023. Currently, the price is in a minor degree wave 4, which initially appeared to be a zigzag structure. However, the sustained sideways price action suggests this is a triangle structure for wave 4. Before the eventual breakout to the upside, Gold might make one more leg lower within the range. The goal now is wave 5.
Gold-XAUUSD-Commodit...


H4 Chart Analysis

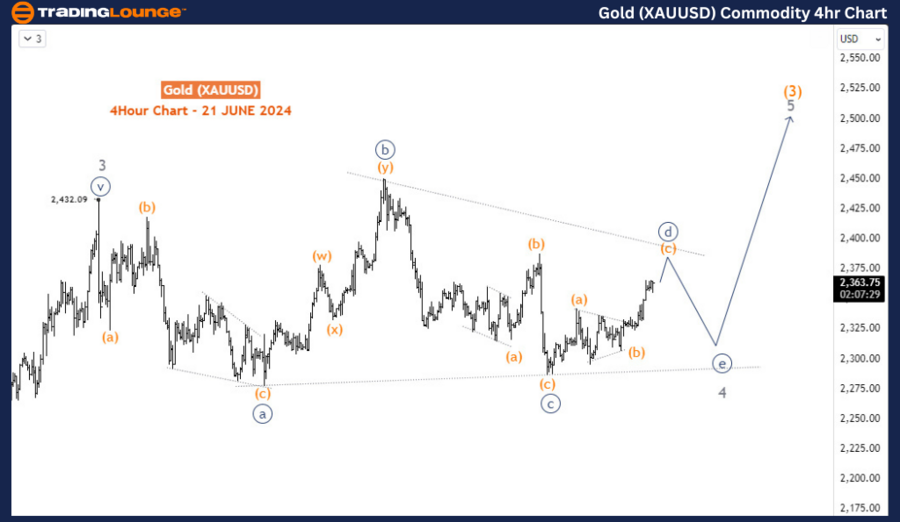
The H4 chart shows the sub-waves of the emerging triangle structure, which is currently on the fourth leg - wave d (circled). Wave e (circled) should follow, but it should stay above 2286 to avoid invalidating the triangle structure. Thus, the invalidation level for this setup is 2286. Provided the price remains above that level, the potential for more upside is far greater. Wave 5 should reach at least the 2500 key psychological level.

Summary

  • Gold has been in a sideways range since the decline on April 12th, 2024, but is expected to make further gains and potentially reach a new all-time high.
  • The long-term trend is bullish, with no significant bearish correction expected until the impulse cycle from September 2023 ends.
  • On the daily chart, Gold is in a cycle degree impulse wave III from 1810.5, with the current minor degree wave 4 forming a triangle structure.
  • On the H4 chart, wave d (circled) of the triangle is in progress, with wave e (circled) expected next.
  • The triangle structure remains valid as long as the price stays above 2286. If this level holds, the potential for more upside increases, with wave 5 likely to reach at least the 2500 level.

Technical Analyst: Sanmi Adeagbo

Source: visit Tradinglounge.com and learn From the Experts Join TradingLounge Here 

See Previous: Wheat Elliott Wave Analysis

Special Trial Offer - 0.76 Cents a Day for 3 Months! Click here

Access 7 Analysts Over 170 Markets Covered. Chat Room With Support
Gold-XAUUSD-4Hr-comm...

Related

New Zealand Dollar/U.S.Dollar (NZDUSD) Forex Elliott Wave Technical Analysis: Comprehensive Market Forecast

New Zealand Dollar/U.S.Dollar (NZDUSD) Forex Elliott Wave Technical Analysis: Comprehensive Market Forecast

This article provides an in-depth Elliott Wave Analysis of the NZDUSD pair on both the daily and 4-h...

Read More >
Australian Dollar/U.S.Dollar (AUDUSD) Elliott Wave Technical Analysis 22 January 24

Australian Dollar/U.S.Dollar (AUDUSD) Elliott Wave Technical Analysis 22 January 24

Australian Dollar/U.S.Dollar (AUDUSD) Elliott Wave Technical Analysis dated 22 January 24, provides ...

Read More >
Caterpillar (CAT) Elliott Wave Analysis: Bullish Stock Forecast with Technical Chart Insights, and Trading Strategy Guide

Caterpillar (CAT) Elliott Wave Analysis: Bullish Stock Forecast with Technical Chart Insights, and Trading Strategy Guide

This analysis provides a comprehensive Elliott Wave breakdown of Caterpillar Inc. (CAT), highlightin...

Read More >
Article provides an in-depth Silver (XAGUSD) Commodity Elliott Wave Technical Analysis

Article provides an in-depth Silver (XAGUSD) Commodity Elliott Wave Technical Analysis

This article provides an in-depth Silver Price Analysis through the lens of Elliott Wave Theory. It ...

Read More >
"Elliott Wave Analysis: NASDAQ 100, SP500, and Top Tech Stocks - Trading Strategies and Market Forecast"

"Elliott Wave Analysis: NASDAQ 100, SP500, and Top Tech Stocks - Trading Strategies and Market Forecast"

This analysis covers the Elliott Wave patterns for NASDAQ 100, SP500, and major tech stocks like App...

Read More >
Euro/U.S.Dollar(EURUSD) 4 Hour Chart Elliott Wave Technical Analysis 10 January 24

Euro/U.S.Dollar(EURUSD) 4 Hour Chart Elliott Wave Technical Analysis 10 January 24

EURUSD Elliott Wave Analysis dated 10 January 24, provides a comprehensive examination of the Euro/U...

Read More >

Buy 1 Month

Get 3 Months!

Special Offer:

Trade Recommendations

Unleash the power of deversified trading with our comprehensive portfolio, covering:

  • Stock Trades
  • Crypto Trades
  • Forex Trades
  • Commodity Trades
Elliott Wave Analysis

Gain a competive edge with expert insights in to:

  • Global Indices
  • US Stocks & ASX Stocks
  • Forex & Crypto
  • Commodities
Top-Notch Trading Tools

Equip yourself with the tools of success:

  • Social Chat
  • Elliott Wave Algorithm
  • Screener
  • TradingLevels
  • Trading Game
7 Elliott Wave Analysts

Stay ahead of the market with daily charts and insightful videos
-Your secret to strategic trading!

JOIN HERE


Welcome to TradingLounge (ASIC A.R.No. 321187), specialists in trades, trading education and technical analysis, covering stocks, indices, commodities, forex and cryptocurrencies.

When you join TradingLounge you have access to everything we offer, including trade tools, educational content and a social platform to chat with like-minded investors.

Read more

@Copyright 2024 by tradinglounge.com

Contact Us

Australian no: 02 4787 6020

International no: +61 (2) 47876020

Pay with:

Find us on