Elliott Wave Analysis TradingLounge Daily Chart,
In today's Elliott Wave Analysis by TradingLounge, we delve into the VeChain/USD (VETUSD) pair, assessing its technical outlook as of 16 February 2024.
VETUSD Elliott Wave Technical Analysis
Trend Following with Impulsive Structure
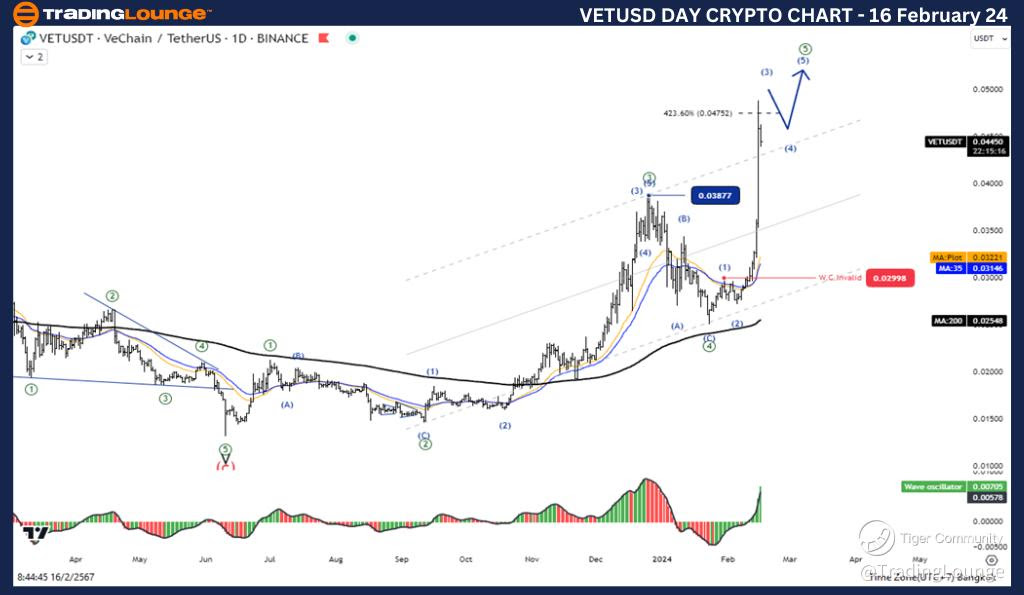
Daily Chart Analysis
Function: Follow trend
Mode: Motive
Structure: Impulse
Position: Wave ((5))
Next Higher Degree Direction: Wave I of Impulse
Invalidation Level: 0.2100
The analysis reveals an impulse structure in progress, with Wave (5) currently underway. Notably, Wave (5) exhibits a five-wave increase, indicating continued bullish momentum. The correction in Wave (4) appears incomplete, suggesting further upward movement in Wave (5).
Trading Strategy: Capitalizing on the Uptrend
Given the incomplete Wave (5) and the bullish sentiment, the overall trend for VeChain remains upward. Traders may consider strategic entries aligned with the ongoing uptrend.
VeChain/ U.S. dollar(VETUSD) Technical Indicators
Technical indicators support the bullish outlook, with the price trading above the MA200, signaling a sustained uptrend. Additionally, Wave Oscillators exhibit bullish momentum, further bolstering the bullish bias.
TradingLounge Analyst: Kittiampon Somboonsod, CEWA
Source: visit Tradinglounge.com and learn From the Experts Join TradingLounge Here
See Previous: Bitcoin/ U.S. Dollar (BTCUSD)
VETUSD Elliott Wave Analysis TradingLounge 4H Chart,
VETUSD Elliott Wave Technical Analysis
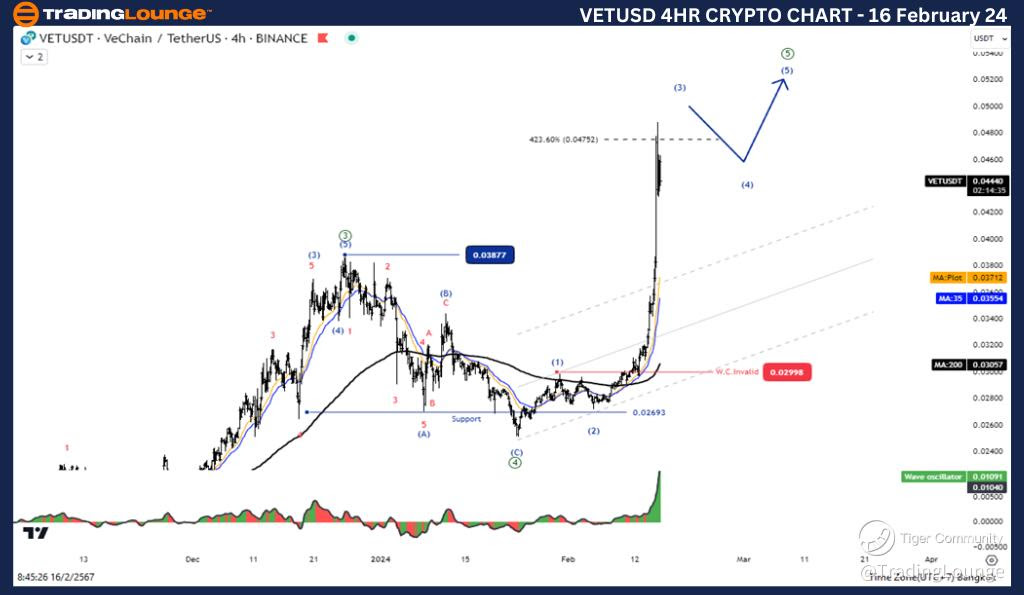
4-Hour Chart Analysis
Continuation of Impulsive Structure
Function: Follow trend
Mode: Motive
Structure: Impulse
Position: Wave ((5))
Next Higher Degree Direction: Wave I of Impulse
Invalidation Level: 0.2100
The 4-hour chart reaffirms the presence of an impulse structure, with Wave (5) progressing. Similar to the daily chart, Wave (5) displays a five-wave increase, indicative of ongoing bullish momentum.
Trading Strategy: Riding the Wave
Traders can capitalize on the upward movement by strategically entering positions aligned with the bullish trend. The incomplete nature of Wave (5) suggests further upside potential for VeChain/USD.
VeChain/ U.S. dollar(VETUSD) Technical Indicators
Technical indicators on the 4-hour chart mirror those on the daily timeframe, with the price trading above the MA200, signaling an uptrend. Additionally, Wave Oscillators reaffirm bullish momentum, supporting the bullish bias.
Conclusion
The Elliott Wave analysis for VeChain/USD (VETUSD) indicates a continuation of the uptrend, with both daily and 4-hour charts portraying bullish structures. Traders may consider capitalizing on the ongoing bullish momentum, utilizing strategic entries aligned with the impulsive price action.
By integrating Elliott Wave principles with technical indicators, traders can make informed decisions, maximizing profit potential in the dynamic cryptocurrency market.