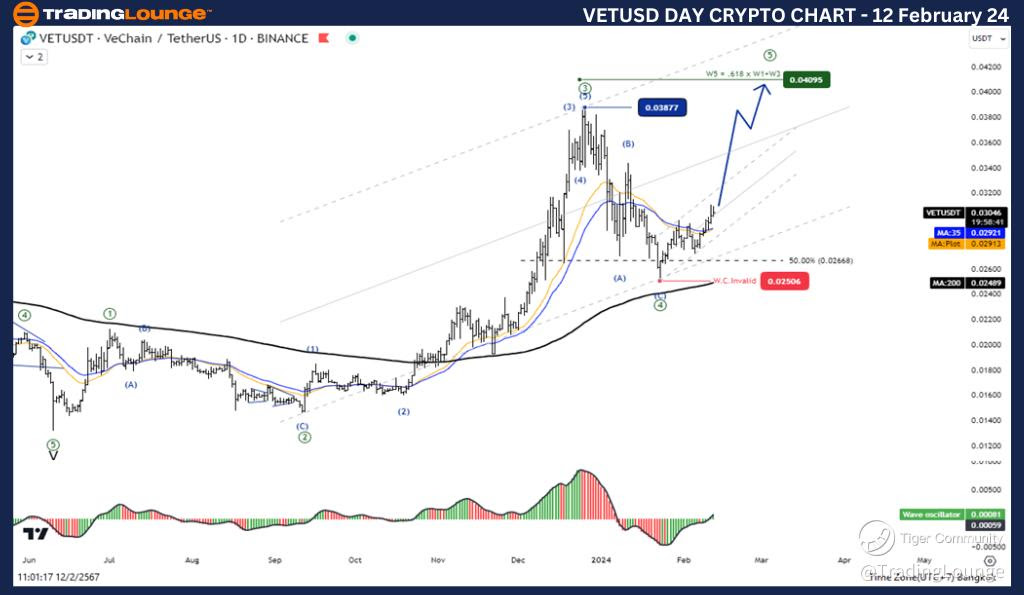
Elliott Wave Analysis for VeChain (VETUSD) - Daily Chart 12 February 24,

VeChain / U.S. dollar(VETUSD)

VETUSD Elliott Wave Technical Analysis

Discover the pulse of VETUSD through Elliott Wave analysis. We identify a motive impulse structure in Wave ((5)), signaling a bullish trend continuation. With Wave ((4)) potentially completing at 0.02506, VeChain is poised for an upward surge in Wave ((5)). Targeting 61.8% Fibonacci extension of Wave ((1)) to ((3)) at 0.04095 sets the stage for potential profit-taking opportunities.

VeChain / U.S. dollar(VETUSD)Technical Indicators:

Riding the uptrend wave, VETUSD's price is comfortably above the MA200, indicating sustained bullish momentum. Wave oscillators further validate this sentiment, highlighting a bullish outlook for VeChain traders.

VETUSD-Day-Crypto-Ch...


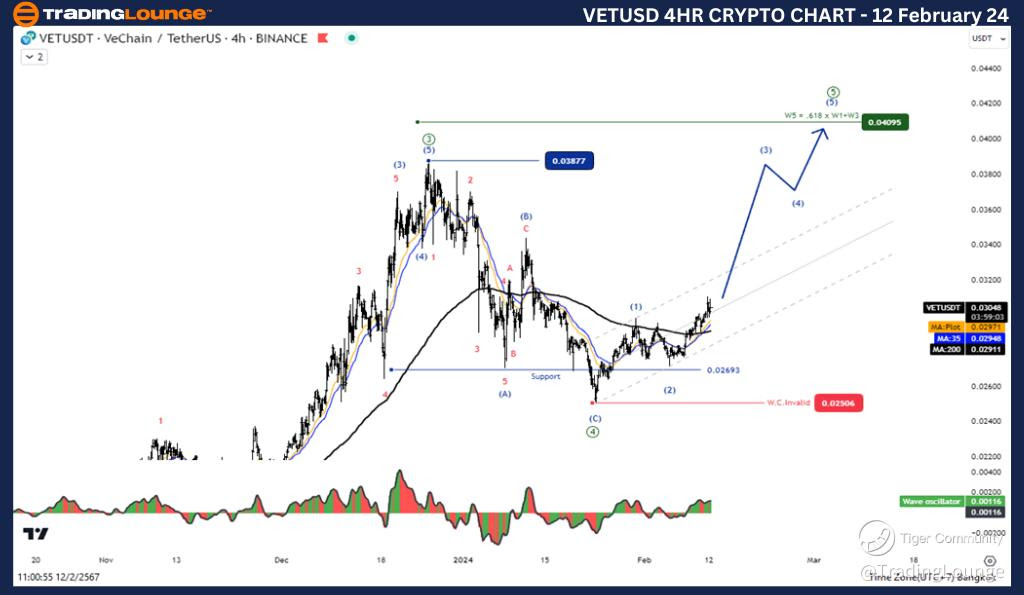
Elliott Wave Analysis for VeChain (VETUSD) - 4H Chart: 12 February 24,

VeChain / U.S. dollar(VETUSD)

VETUSD Elliott Wave Technical Analysis

Delve deeper into VETUSD's intraday movements with our Elliott Wave analysis on the 4-hour chart. The motive impulse structure in Wave ((5)) persists, reinforcing the bullish trajectory. Wave ((4)) conclusion at 0.02506 sets the stage for Wave ((5)) ascension, targeting 61.8% Fibonacci extension at 0.04095.

VeChain / U.S. dollar(VETUSD) Technical Indicators:

Continuing the bullish narrative, VeChain's price maintains its position above the MA200 on the 4-hour chart, indicating an ongoing uptrend. Supported by wave oscillators, bullish momentum remains robust, offering traders favorable conditions for potential profit accumulation.

TradingLounge Analyst: Kittiampon Somboonsod, CEWA

Source: visit Tradinglounge.com and learn From the Experts Join TradingLounge Here 

See Previous: BNBUSD

VETUSD-4h-Crypto-Cha...

Unlock Your Trading Potential with TradingLounge:

Empower your trading journey with TradingLounge's comprehensive analysis and expert insights. Join our community and gain access to cutting-edge tools and resources to elevate your trading strategies. With seize the opportunity to enhance your trading proficiency today.

Conclusion:

Master the art of VeChain trading with Elliott Wave analysis. Harness the power of trend-following strategies and capitalize on VETUSD's bullish momentum. Stay ahead of the curve with our expert analysis and unlock lucrative trading opportunities. Join TradingLounge today and embark on a journey towards trading success.

Related

Newmont Corporation Elliott Wave Analysis: ASX:NEM Price Forecast, Bullish Trend, Wave Targets, Technical Outlook, and Key Levels

Newmont Corporation Elliott Wave Analysis: ASX:NEM Price Forecast, Bullish Trend, Wave Targets, Technical Outlook, and Key Levels

Explore an in-depth Elliott Wave analysis of ASX: NEM. Track Newmont's bullish trend, wave targe...

Read More >
Avery Dennison Corp.(AVY) Elliott Wave Technical Analysis: Examines Both Daily and 1-Hour Charts to Forecast Stocks Movements

Avery Dennison Corp.(AVY) Elliott Wave Technical Analysis: Examines Both Daily and 1-Hour Charts to Forecast Stocks Movements

This article provides an in-depth analysis of Avery Dennison Corp. (AVY) using Elliott Wave Theory. ...

Read More >
DJI Elliott Wave Technical Analysis: Dow Jones Index Market Analysis signals a bullish trend, with Wave Driving Upward Momentum

DJI Elliott Wave Technical Analysis: Dow Jones Index Market Analysis signals a bullish trend, with Wave Driving Upward Momentum

The Dow Jones Elliott Wave analysis signals a bullish trend, with Orange Wave 3 and Navy Blue Wave 5...

Read More >
THETAUSD Elliott Wave Technical Analysis: Theta/U.S. Dollar Pair Highlights Critical Support and Resistance Levels

THETAUSD Elliott Wave Technical Analysis: Theta/U.S. Dollar Pair Highlights Critical Support and Resistance Levels

This article provides an in-depth THETAUSD Elliott Wave analysis, covering the latest price trends, ...

Read More >
Microsoft Corp.(MSFT:NASDAQ) Elliott Wave Technical Analysis 16 October 23

Microsoft Corp.(MSFT:NASDAQ) Elliott Wave Technical Analysis 16 October 23

Microsoft Corp. Elliott Wave Technical Analysis with 1-hour and 4-hour charts for 16 October 23. Tra...

Read More >
BLOCK, INC - XYZ (SQ2) Elliott Wave Analysis & Elliott Wave Technical Chart Predicts Bullish Target with Key Support Holding

BLOCK, INC - XYZ (SQ2) Elliott Wave Analysis & Elliott Wave Technical Chart Predicts Bullish Target with Key Support Holding

This article provides a complete Elliott Wave analysis for ASX: BLOCK INC - SQ2, highlighting a bull...

Read More >

$1 for 2 Weeks

then $29 a month!

What a Special Offer!

Trade Recommendations

Unleash the power of deversified trading with our comprehensive portfolio, covering 250+ markets:

  • Stock Trades
  • Crypto Trades
  • Forex Trades
  • Commodity Trades
Elliott Wave Analysis

Gain a competitive edge with expert insights and AI-powered Elliott Wave charting into:

  • Global Indices
  • US Stocks & ASX Stocks
  • Forex & Crypto
  • Commodities
Top-Notch Trading Tools

Equip yourself with the tools of success:

  • Real-time Chat rooms
  • Elliott Wave Algorithm
  • Portfolio tools
  • TradingLevels
  • Screener
  • Trading Game
7 Elliott Wave Analysts

Stay ahead of the market with daily charts and insightful videos
Your secret to strategic trading!

JOIN HERE


Welcome to TradingLounge (ASIC A.R.No. 321187), specialists in trades, trading education and technical analysis, covering stocks, indices, commodities, forex and cryptocurrencies.

When you join TradingLounge you have access to everything we offer, including trade tools, educational content and a social platform to chat with like-minded investors.

Read more

@Copyright 2024 by tradinglounge.com

Contact Us

Australian no: 02 4787 6020

International no: +61 (2) 47876020

Pay with:

Find us on