Deere & Co. (DE) Elliott Wave Analysis: Current Trends and Projections
This Elliott Wave analysis of Deere & Co. (DE) examines the daily and 1-hour chart structures, highlighting current trends and potential future price movements with precision.
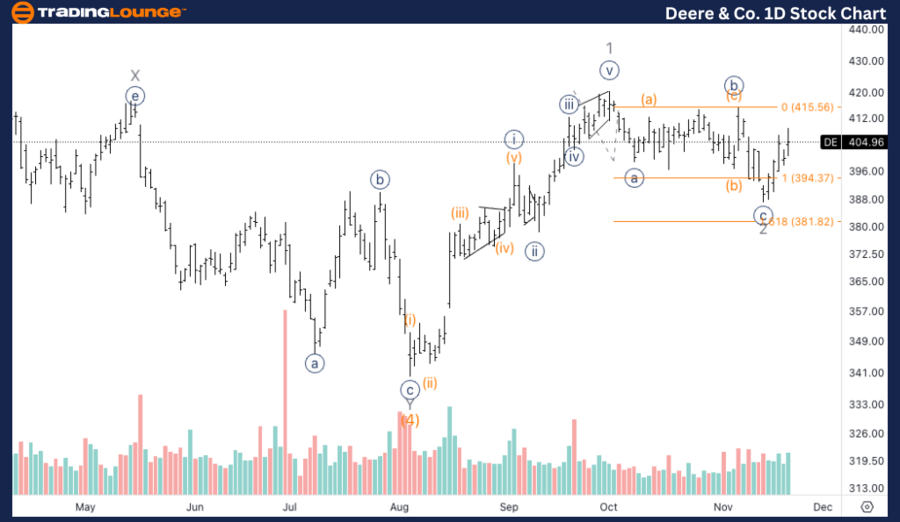
DE Elliott Wave Analysis – TradingLounge Daily Chart
Deere & Co. (DE) Daily Chart Overview
DE Elliott Wave Technical Analysis and Overview
Function: Trend
Mode: Impulsive
Structure: Motive
Position: Wave {i} of 3
Direction: Upside into Wave 3
Key Insights:
Deere & Co. appears to have established a bottom in Wave 2 after achieving equality between wave {c} and wave {a}. This suggests the initiation of Wave {i} of 3, with volume patterns supporting a potential bullish trend. If this structure holds, Wave 3 typically signals a strong impulsive move, potentially leading to substantial upward momentum.

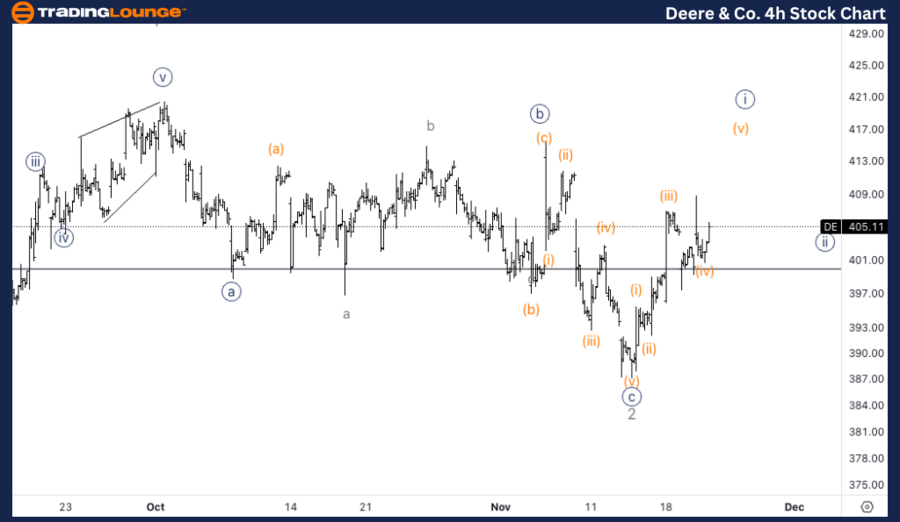
DE Elliott Wave Analysis – TradingLounge 1-Hour Chart
Deere & Co. (DE) 1-Hour Chart Overview
Technical Analysis Overview
Function: Trend
Mode: Impulsive
Structure: Motive
Position: Wave (v) of {i}
Direction: Upside into Wave (v)
Key Insights:
The 1-hour chart indicates a triangle pattern in Wave (iv), a standard corrective structure before an upward breakout. Once the triangle resolves, Wave (v) is expected to accelerate higher, completing minute Wave {i} of the larger impulsive trend. Traders may anticipate a bullish breakout as this triangle concludes, potentially signaling the next leg of the upward trend.
Technical Analyst: Alessio Barretta
Source: visit Tradinglounge.com and learn From the Experts Join TradingLounge Here
See Previous: Salesforce Inc (CRM) Elliott Wave Technical Analysis
VALUE Offer - Buy 1 Month & Get 3 Months!Click here
Access 7 Analysts Over 200 Markets Covered. Chat Room With Support
