20Nov

Salesforce (CRM) Elliott Wave Analysis: Explores the Stock's Current Trends and Forecast Based on Wave 3 Momentum

This analysis focuses on the current trend structure of Salesforce Inc., (CRM) utilizing the Elliott Wave Theory on both the daily and 1-hour charts. Below is a breakdown of the stock's position and potential future movements.

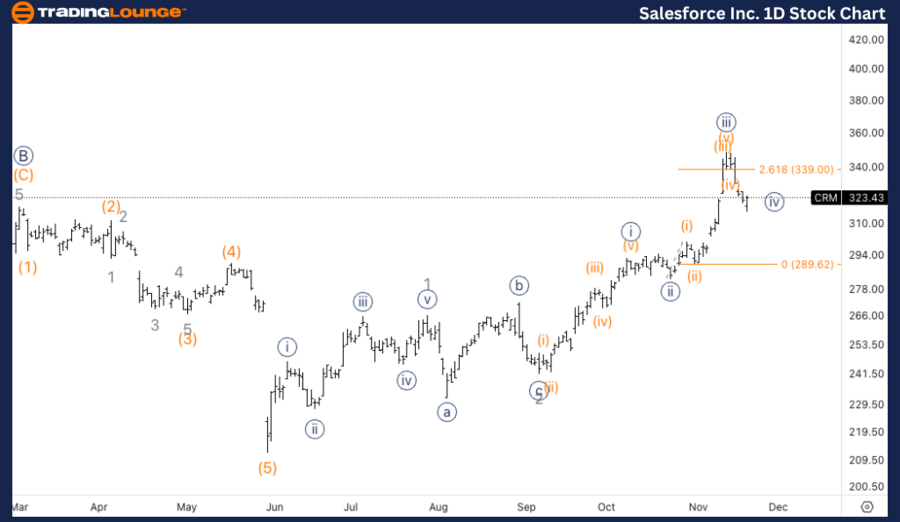
CRM Elliott Wave Analysis – Salesforce Inc. (CRM) Daily Chart

CRM Elliott Wave Technical Analysis – Daily Chart

Function: Trend

Mode: Impulsive

Structure: Motive

Position: Minor Wave 3

Direction: Upside within Wave 3

Details: Salesforce Inc. (CRM) is advancing in an impulsive Minor wave 3, holding above the critical support level, Trading Level 3 (TL3), at $300. This upward momentum aligns with the Elliott Wave Theory's characteristics of wave 3, which typically exhibit strong bullish activity. Investors can expect a continuation of this upward trend, targeting higher highs as the structure remains intact.

CRM Elliott Wave Technical Analysis – Daily Chart

On the daily chart, Salesforce (CRM) is advancing within Minor wave 3, building momentum as it holds above Trading Level 3 at $300. This suggests bullish continuation, with the possibility of setting new highs in line with the ongoing impulsive structure. The trend remains upward, and the focus is on further gains as wave 3 typically exhibits strong momentum.

Salesforce-Inc-1D-St...


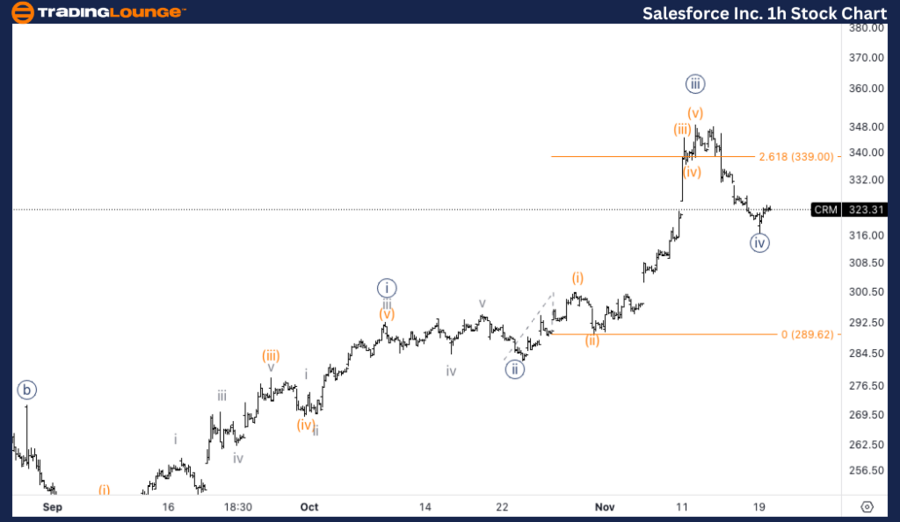
CRM Elliott Wave Technical Analysis – 1-Hour Chart

Function: Trend

Mode: Impulsive

Structure: Motive

Position: Wave {iv} of 3

Direction: Bottoming in Wave {iv}

Details: On the 1-hour chart, CRM is completing wave {iv} of Minor wave 3. This corrective wave could manifest either as a sharp decline or a sideways consolidation. Traders should monitor closely for signs of a confirmed bottom, which will signal the beginning of wave {v}. This next phase may bring renewed bullish momentum, aligning with the broader uptrend visible in the daily chart.

CRM Elliott Wave Technical Analysis – 1H Chart

On the 1-hour chart, CRM is likely near the end of wave {iv} of Minor wave 3. This wave could take the form of either a sharp correction or sideways consolidation, providing a base for the next leg higher in wave {v}. Traders should watch for signs of a confirmed bottom and renewed upside momentum, particularly as the structure of wave {iv} unfolds in the coming sessions.

Technical Analyst: Alessio Barretta

Source: visit Tradinglounge.com and learn From the Experts Join TradingLounge Here 

See Previous: The Walt Disney Co. (DIS) Elliott Wave Technical Analysis

VALUE Offer - Buy 1 Month & Get 3 Months!Click here

Access 7 Analysts Over 200 Markets Covered. Chat Room With Support

Salesforce-Inc-1h-St...

Related

NIFTY 50 Elliott Wave Analysis – Market Trend Forecast, Impulse & Corrective Waves, Trading Signals, and Stock Market Predictions

NIFTY 50 Elliott Wave Analysis – Market Trend Forecast, Impulse & Corrective Waves, Trading Signals, and Stock Market Predictions

NIFTY 50 Elliott Wave analysis, highlighting market trends, impulse waves, and corrective structures...

Read More >
Binance Crypto Price News Today Elliott Wave Technical Analysis: Depth Cryptocurrency Analysis and BNBUSD Price Predictions

Binance Crypto Price News Today Elliott Wave Technical Analysis: Depth Cryptocurrency Analysis and BNBUSD Price Predictions

This article dives into BNBUSD Elliott Wave analysis, providing insights into Binance Coin’s potent...

Read More >
IBEX 35 Market Analysis: IBEX 35 (Spain) Index Elliott Wave Technical Analysis with Daily and Weekly Charts

IBEX 35 Market Analysis: IBEX 35 (Spain) Index Elliott Wave Technical Analysis with Daily and Weekly Charts

The IBEX 35 Elliott Wave analysis provides a detailed look at the market's current trends on bot...

Read More >
Detailed Analysis Covers Cocoa Commodity Elliott Wave Technical Analysis

Detailed Analysis Covers Cocoa Commodity Elliott Wave Technical Analysis

Discover the intricacies of Elliott Wave Analysis applied to cocoa trading. This detailed analysis c...

Read More >
British Pound/U.S.Dollar(GBPUSD) Forex Elliott Wave Technical Analysis: Day and 4-Hour Charts Overview

British Pound/U.S.Dollar(GBPUSD) Forex Elliott Wave Technical Analysis: Day and 4-Hour Charts Overview

This article offers a comprehensive guide to trading the GBP/USD pair using the Elliott Wave theory....

Read More >

$1 for 2 Weeks

then $29 a month!

What a Special Offer!

Trade Recommendations

Unleash the power of deversified trading with our comprehensive portfolio, covering 250+ markets:

  • Stock Trades
  • Crypto Trades
  • Forex Trades
  • Commodity Trades
Elliott Wave Analysis

Gain a competitive edge with expert insights and AI-powered Elliott Wave charting into:

  • Global Indices
  • US Stocks & ASX Stocks
  • Forex & Crypto
  • Commodities
Top-Notch Trading Tools

Equip yourself with the tools of success:

  • Real-time Chat rooms
  • Elliott Wave Algorithm
  • Portfolio tools
  • TradingLevels
  • Screener
  • Trading Game
7 Elliott Wave Analysts

Stay ahead of the market with daily charts and insightful videos
Your secret to strategic trading!

JOIN HERE


Welcome to TradingLounge (ASIC A.R.No. 321187), specialists in trades, trading education and technical analysis, covering stocks, indices, commodities, forex and cryptocurrencies.

When you join TradingLounge you have access to everything we offer, including trade tools, educational content and a social platform to chat with like-minded investors.

Read more

@Copyright 2024 by tradinglounge.com

Contact Us

Australian no: 02 4787 6020

International no: +61 (2) 47876020

Pay with:

Find us on