28Apr

Cocoa Elliott Wave Analysis: Forecasting Price Correction, Bullish Trend, and Trading Strategies for Cocoa Futures and Investments

Cocoa Commodity Elliott Wave Technical Analysis

After reaching a record high in December 2024, cocoa prices have been undergoing a corrective decline against the October 2024 low. The pullback completed a 5-wave structure lower from the 12931 record high and is now retracing the decline with higher prices. Based on Elliott Wave analysis, another 5-wave decline is anticipated following the current bounce, unless cocoa prices manage to surpass the previous record high.

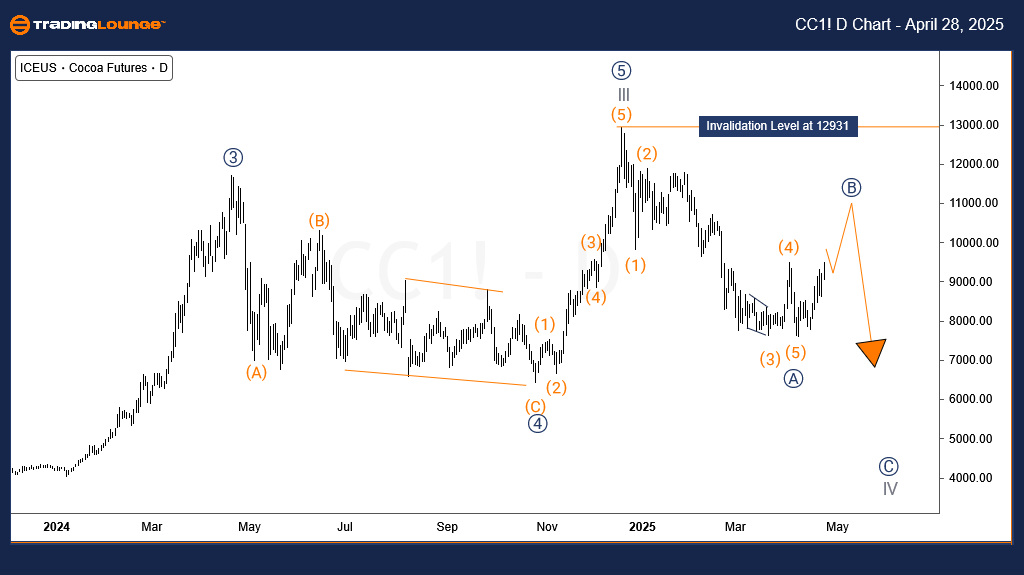
Cocoa Elliott Wave Analysis - Daily Chart

Cocoa maintains a strong long-term bullish trend starting from the December 2000 low. From the $707 low in December 2000, cocoa prices completed a 5-wave impulsive structure, peaking at $3775 in February 2011. A corrective second wave followed, ending in April 2017 at $1756. The third wave began in April 2017 and remains in progress, unfolding as an impulse wave pattern. So far, we can identify a 3-swing rally from the December 2000 bullish cycle, suggesting the potential development of either a 3-wave or a 5-wave cycle. Given the origin from an all-time low, probabilities favor a full 5-wave impulsive sequence. Therefore, cocoa prices are currently advancing within the ongoing third wave, yet to complete.

Further analysis suggests that cocoa is in the third sub-wave of the ongoing third wave. The daily Elliott Wave chart shows that the recent record high marks the end of wave III of (III) of ((III)). The subsequent pullback could evolve into a more complex double correction. Accordingly, the April 2025 low signifies the completion of an impulse structure for wave ((A)) of IV, with the current rebound representing wave ((B)) within the wave IV correction.

Cocoa-Commodity-Day-...


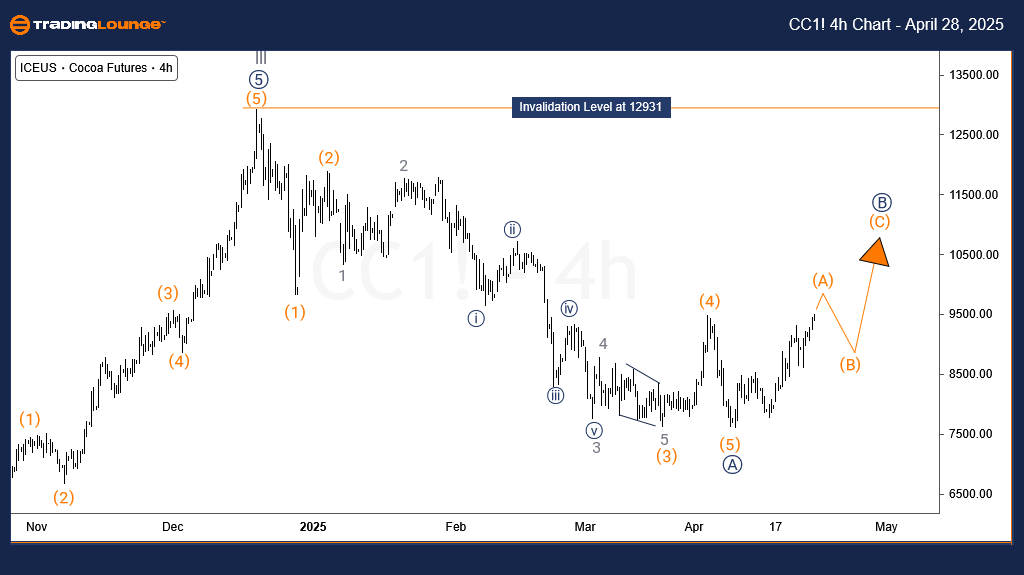
Cocoa Elliott Wave Analysis - H4 Chart

The 4-hour chart shows a bullish impulse structure developing from the April 2025 low for wave (A) of ((B)). As wave ((B)) extends higher, cocoa prices are expected to stay below the 12931 record high before sellers initiate wave ((C)) downward, completing the larger wave IV pullback. The long-term bullish trend is expected to resume after wave IV finishes. However, if the ongoing rally breaks above 12931, it would confirm that wave IV has already concluded at the April 2025 low, opening the path for further bullish extension in cocoa prices.

Technical Analyst: Sanmi Adeagbo

Source: Visit Tradinglounge.com and learn from the Experts Join TradingLounge Here 

See Previous: WTI Crude Oil Elliott Wave Technical Analysis

VALUE Offer - Buy 1 Month & Get 3 Months!Click here

Access 7 Analysts Over 200 Markets Covered. Chat Room With Support

Cocoa-Commodity-4h-C...

Related

AMCOR PLC Stock with detailed chart analysis– AMC Stock Analysis & AMC Elliott Wave Technical Forecast

AMCOR PLC Stock with detailed chart analysis– AMC Stock Analysis & AMC Elliott Wave Technical Forecast

This article provides an in-depth Elliott Wave analysis of AMCOR PLC (AMC) on the Australian Stock E...

Read More >
NEE Stocks Elliott Wave Technical Analysis: NextEra Energy Inc. (NEE) Stock Analysis & Strategic Forecast

NEE Stocks Elliott Wave Technical Analysis: NextEra Energy Inc. (NEE) Stock Analysis & Strategic Forecast

This article offers an in-depth Elliott Wave analysis of NextEra Energy Inc. (NEE), breaking down bo...

Read More >
Euro/U.S.Dollar(EURUSD) Day Chart Elliott Wave Technical Analysis 10 November 23

Euro/U.S.Dollar(EURUSD) Day Chart Elliott Wave Technical Analysis 10 November 23

Euro/U.S.Dollar(EURUSD) Day Chart Elliott Wave Technical Analysis 10 November 23 suggests a Counter ...

Read More >
Australian Dollar/U.S. Dollar (AUDUSD) Elliott Wave Analysis for Daily and 4-Hour Charts Featuring Forecast, and Key Technical Levels

Australian Dollar/U.S. Dollar (AUDUSD) Elliott Wave Analysis for Daily and 4-Hour Charts Featuring Forecast, and Key Technical Levels

AUDUSD Elliott Wave technical analysis provides a detailed breakdown of the current wave structure o...

Read More >
AXIS BANK LTD. Elliott Wave Analysis: Share Price Forecast, Technical Trends, and Key Support & Resistance Levels

AXIS BANK LTD. Elliott Wave Analysis: Share Price Forecast, Technical Trends, and Key Support & Resistance Levels

AXIS BANK stock analysis using Elliott Wave theory. This article covers share price forecasts, techn...

Read More >
Adani Enterprises Elliott Wave Analysis: Technical Insights, Price Predictions, and Chart Analysis for Informed Trading Decisions

Adani Enterprises Elliott Wave Analysis: Technical Insights, Price Predictions, and Chart Analysis for Informed Trading Decisions

A comprehensive Elliott Wave analysis of Adani Enterprises discovers insights into the stock's c...

Read More >

$1 for 2 Weeks

then $29 a month!

What a Special Offer!

Trade Recommendations

Unleash the power of deversified trading with our comprehensive portfolio, covering 250+ markets:

  • Stock Trades
  • Crypto Trades
  • Forex Trades
  • Commodity Trades
Elliott Wave Analysis

Gain a competitive edge with expert insights and AI-powered Elliott Wave charting into:

  • Global Indices
  • US Stocks & ASX Stocks
  • Forex & Crypto
  • Commodities
Top-Notch Trading Tools

Equip yourself with the tools of success:

  • Real-time Chat rooms
  • Elliott Wave Algorithm
  • Portfolio tools
  • TradingLevels
  • Screener
  • Trading Game
7 Elliott Wave Analysts

Stay ahead of the market with daily charts and insightful videos
Your secret to strategic trading!

JOIN HERE


Welcome to TradingLounge (ASIC A.R.No. 321187), specialists in trades, trading education and technical analysis, covering stocks, indices, commodities, forex and cryptocurrencies.

When you join TradingLounge you have access to everything we offer, including trade tools, educational content and a social platform to chat with like-minded investors.

Read more

@Copyright 2024 by tradinglounge.com

Contact Us

Australian no: 02 4787 6020

International no: +61 (2) 47876020

Pay with:

Find us on