ASX: INSURANCE AUSTRALIA GROUP LIMITED (IAG) Elliott Wave Technical Analysis – TradingLounge
Elliott Wave Analysis for ASX: IAG – Market Update
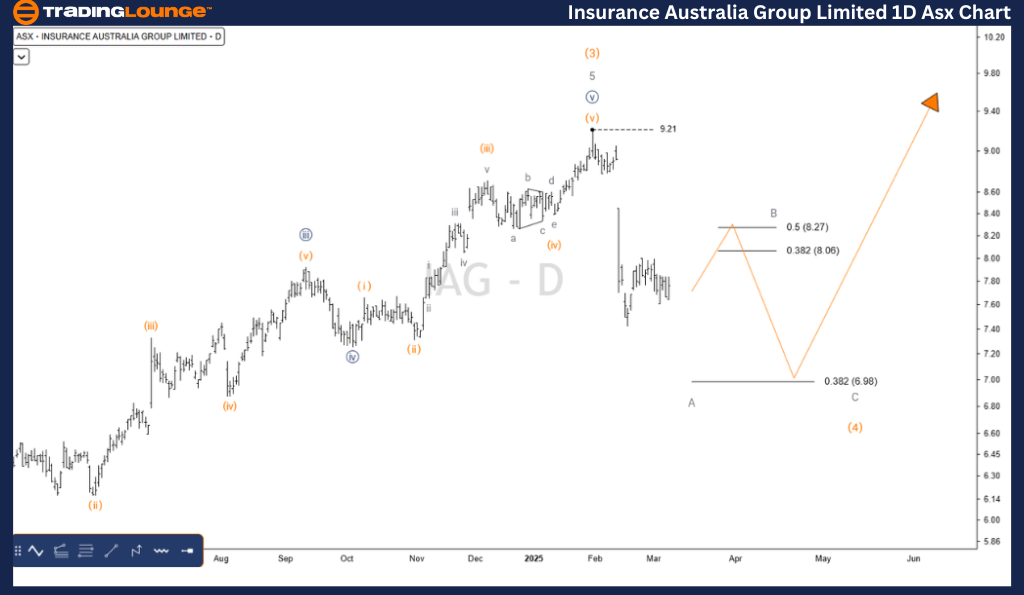
Today's Elliott Wave analysis examines INSURANCE AUSTRALIA GROUP LIMITED (ASX: IAG), providing key insights into its price movement. Currently, ASX: IAG shares remain in a corrective wave, suggesting a further downward move before a potential bullish reversal.
ASX: INSURANCE AUSTRALIA GROUP LIMITED (IAG) Elliott Wave Technical Analysis
1-Day Chart (Semilog Scale) Analysis
Function: Major Trend (Primary Degree – Navy)
Mode: Motive
Structure: Impulse
Position: Wave (4) – Orange
Technical Insights:
- Wave (3) – Orange has completed its five-wave structure, labeled 1-Grey to 5-Grey.
- Wave (4) – Orange is currently pushing lower toward the next support level at 6.982.
- Instead of a strong bullish trend in Wave (5) – Orange, the price action suggests that Wave (4) – Orange is forming an ABC Zigzag correction.
- Invalidation Point: 9.210
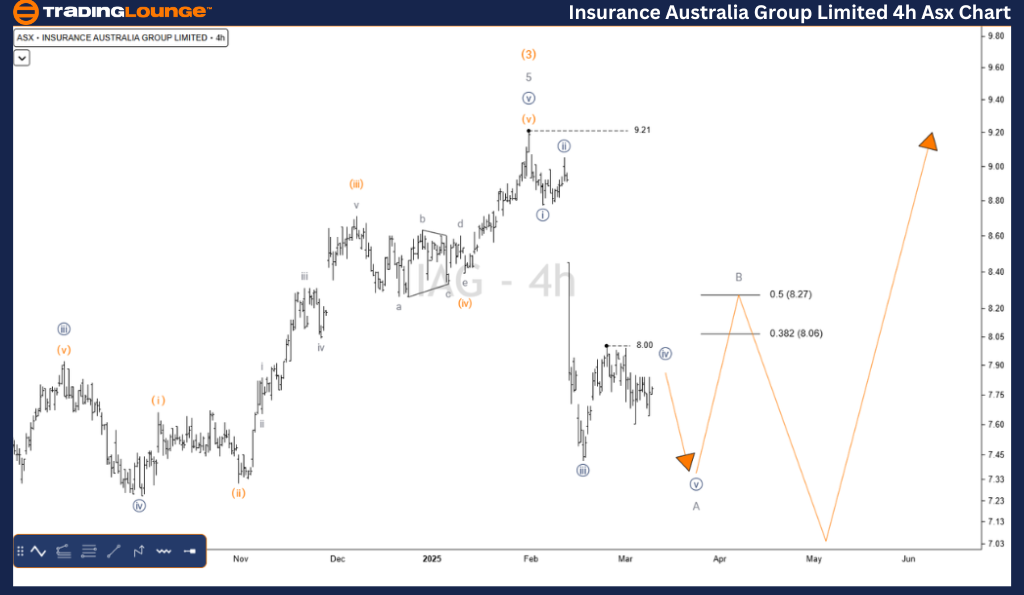
ASX: IAG Elliott Wave Technical Analysis – 4-Hour Chart
4-Hour Chart Analysis
Function: Major Trend (Intermediate Degree – Orange)
Mode: Motive
Structure: Impulse
Position: Wave A – Grey of Wave (4) – Orange
Technical Breakdown:
- The correction within Wave (4) – Orange is still developing to the downside.
- A clear ABC-Grey corrective pattern is forming, with Wave A nearing completion.
- The C-Grey wave is expected to extend downward, aligning with the overall corrective structure.
- Invalidation Point: 9.210
Technical Analyst: Hua (Shane) Cuong, CEWA-M (Master’s Designation).
Source: visit Tradinglounge.com and learn From the Experts Join TradingLounge Here
See Previous: JAMES HARDIE INDUSTRIES PLC (JHX) Elliott Wave Technical Analysis
VALUE Offer - Buy 1 Month & Get 3 Months!Click here
Access 7 Analysts Over 200 Markets Covered. Chat Room With Support
Conclusion
This ASX: IAG Elliott Wave analysis highlights current market trends and potential trading opportunities. By identifying key price validation and invalidation levels, traders can enhance their confidence in the Elliott Wave count. The ongoing corrective phase suggests further downside before a potential bullish reversal, making it crucial for traders to monitor key support levels.