18Feb

NEOUSD Elliott Wave Analysis: NEO Price Prediction, Breakout Levels, Fibonacci Support, and Market Trends for Crypto Investors

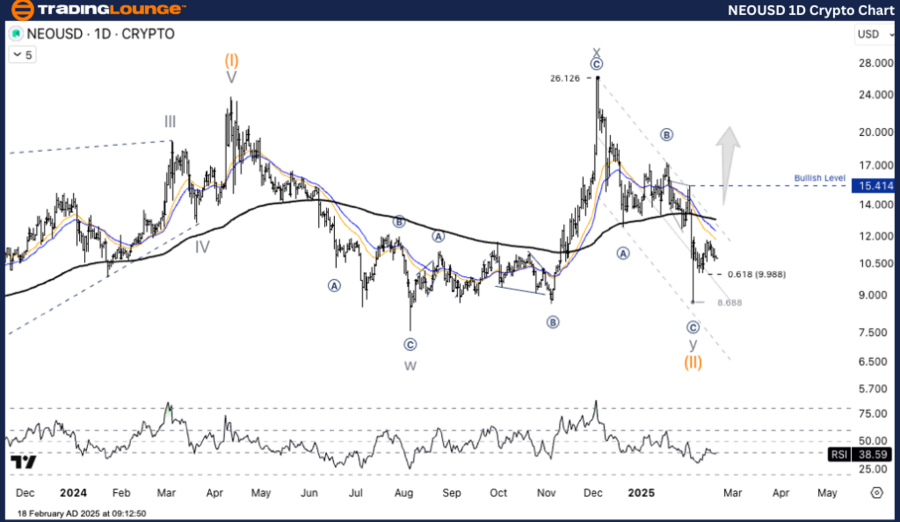
NEO/ U.S. Dollar (NEOUSD) Elliott Wave Analysis –  Daily Chart

NEOUSD Elliott Wave Technical Analysis

Function: Counter-Trend

Mode: Corrective

Structure: Zigzag

Position: Wave ((C))

Next Higher Degree Direction: Wave Y

Wave Invalidation Level: N/A

Analysis: The correction is following a WXY pattern, which has completed near 8.688 USD.

NEO/ U.S. Dollar (NEOUSD) Trading Strategy

The ongoing correction follows a WXY structure, with the pattern completing at 8.688 USD.

Key Resistance Level:

  • 15.414 USD (Bullish Breakout Level) → A breakout above this level signals the start of an uptrend.

Trading Strategies

Long Strategy:

  • Aggressive Entry: Consider buying in the 9.988 - 8.688 USD range, provided a reversal signal confirms a potential uptrend.
  • Breakout Entry: Enter a long position if the price breaks above 15.414 USD with strong buying volume.

Risk Management:

  • Invalidation Point: Exit the position if the price falls below 8.688 USD, invalidating the bullish setup.

NEOUSD-1d-crypto-cha...


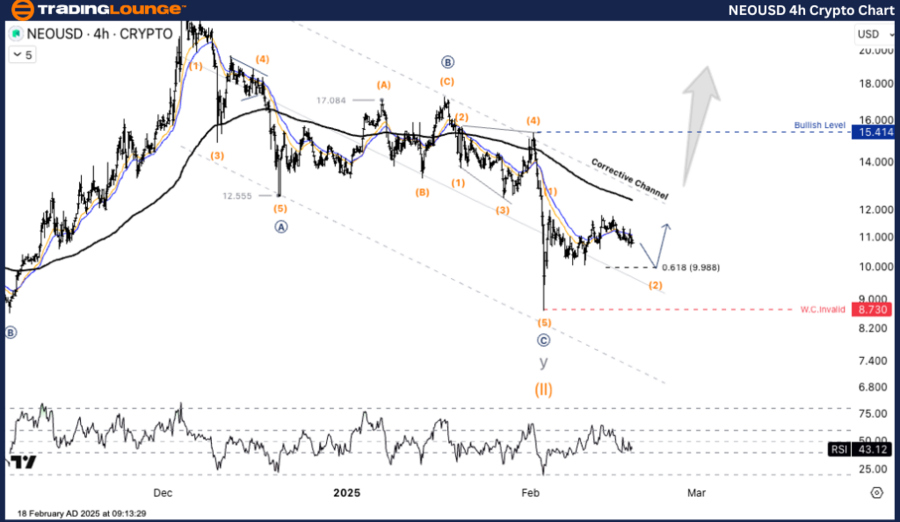
NEO/ U.S. Dollar (NEOUSD) Elliott Wave Analysis –  H4 Chart

NEOUSD Elliott Wave Technical Analysis

Function: Counter-Trend

Mode: Corrective

Structure: Zigzag

Position: Wave ((C))

Next Higher Degree Direction: Wave Y

Wave Invalidation Level: N/A

Analysis: The correction is currently in Wave (2), with a Fib 0.618 support level at 9.988 USD.

NEO/ U.S. Dollar (NEOUSD) Trading Strategy

The WXY correction has completed near 8.688 USD, indicating a potential reversal.

Key Resistance Level:

  • 15.414 USD (Bullish Breakout Level) → A breakout above this level signals uptrend continuation.

Trading Strategies

Long Strategy:

  • Aggressive Entry: Buy within the 9.988 - 8.688 USD range if bullish reversal signals appear.
  • Breakout Entry: Go long when the price crosses 15.414 USD with strong volume, confirming an uptrend.

Risk Management:

  • Invalidation Point: Exit the trade if the price drops below 8.688 USD, signaling further downside risk.

Technical Analyst: Kittiampon Somboonsod

Source: visit Tradinglounge.com and learn From the Experts Join TradingLounge Here 

Previous: ADAUSD Elliott Wave Technical Analysis

VALUE Offer - Buy 1 Month & Get 3 Months!Click here

Access 7 Analysts Over 200 Markets Covered. Chat Room With Support

NEOUSD-4h-crypto-cha...

Related

Amazon Elliott Wave Forecast Shows Strong Bullish Momentum in Daily and Hourly Charts with Accurate Wave Count Predictions

Amazon Elliott Wave Forecast Shows Strong Bullish Momentum in Daily and Hourly Charts with Accurate Wave Count Predictions

This Elliott Wave analysis of AMZN outlines bullish trends in both daily and 1-hour charts, forecast...

Read More >
Trend Analysis: SP500, NASDAQ,  AAPL,  AMZN,  NVDA,  META,  NFLX,  GOOGL,  MSFT,  TSLA &  Bitcoin

Trend Analysis: SP500, NASDAQ, AAPL, AMZN, NVDA, META, NFLX, GOOGL, MSFT, TSLA & Bitcoin

Stocks and Indices are in a Elliott Wave four corrective pattern and in the final stages over the we...

Read More >
IBEX 35 (Spain) Elliott Wave Technical Analysis: Key Trends, Wave Patterns, and Trading Insights

IBEX 35 (Spain) Elliott Wave Technical Analysis: Key Trends, Wave Patterns, and Trading Insights

The IBEX 35 Elliott Wave analysis provides actionable insights into the Spanish stock index's pr...

Read More >
Elliott Wave Analysis & Trading Strategies for Top NASDAQ Tech Stocks | NDX, SPX, AAPL, TSLA, BTC & More

Elliott Wave Analysis & Trading Strategies for Top NASDAQ Tech Stocks | NDX, SPX, AAPL, TSLA, BTC & More

This analysis covers the Elliott Wave patterns and trading strategies for top NASDAQ tech stocks inc...

Read More >
Unlocking ASX Trading Success: COMMONWEALTH BANK OF AUSTRALIA. - CBA Stock Analysis & Elliott Wave Technical Forecast

Unlocking ASX Trading Success: COMMONWEALTH BANK OF AUSTRALIA. - CBA Stock Analysis & Elliott Wave Technical Forecast

Commonwealth Bank of Australia (CBA) using the Elliott Wave method provides traders with critical i...

Read More >
Fortinet Inc. (FTNT) Elliott Wave Analysis Reveals Bullish Trends with Strong Support Above $100

Fortinet Inc. (FTNT) Elliott Wave Analysis Reveals Bullish Trends with Strong Support Above $100

Fortinet Inc. (FTNT) exhibits a strong bullish structure in its Elliott Wave analysis, indicating po...

Read More >

$1 for 2 Weeks

then $29 a month!

What a Special Offer!

Trade Recommendations

Unleash the power of deversified trading with our comprehensive portfolio, covering 250+ markets:

  • Stock Trades
  • Crypto Trades
  • Forex Trades
  • Commodity Trades
Elliott Wave Analysis

Gain a competitive edge with expert insights and AI-powered Elliott Wave charting into:

  • Global Indices
  • US Stocks & ASX Stocks
  • Forex & Crypto
  • Commodities
Top-Notch Trading Tools

Equip yourself with the tools of success:

  • Real-time Chat rooms
  • Elliott Wave Algorithm
  • Portfolio tools
  • TradingLevels
  • Screener
  • Trading Game
7 Elliott Wave Analysts

Stay ahead of the market with daily charts and insightful videos
Your secret to strategic trading!

JOIN HERE


Welcome to TradingLounge (ASIC A.R.No. 321187), specialists in trades, trading education and technical analysis, covering stocks, indices, commodities, forex and cryptocurrencies.

When you join TradingLounge you have access to everything we offer, including trade tools, educational content and a social platform to chat with like-minded investors.

Read more

@Copyright 2024 by tradinglounge.com

Contact Us

Australian no: 02 4787 6020

International no: +61 (2) 47876020

Pay with:

Find us on