Coffee Elliott Wave Analysis
Coffee prices have remained inside a sideways correction since the February 2025 peak. Despite this consolidation, the long-term bullish outlook is still valid. The current pattern resembles a triangle, which typically forms ahead of the final wave in a cycle. Based on Elliott Wave theory, the bullish cycle that began in October 2023 could be nearing its end after one more upward move, which may lead to a larger corrective phase.
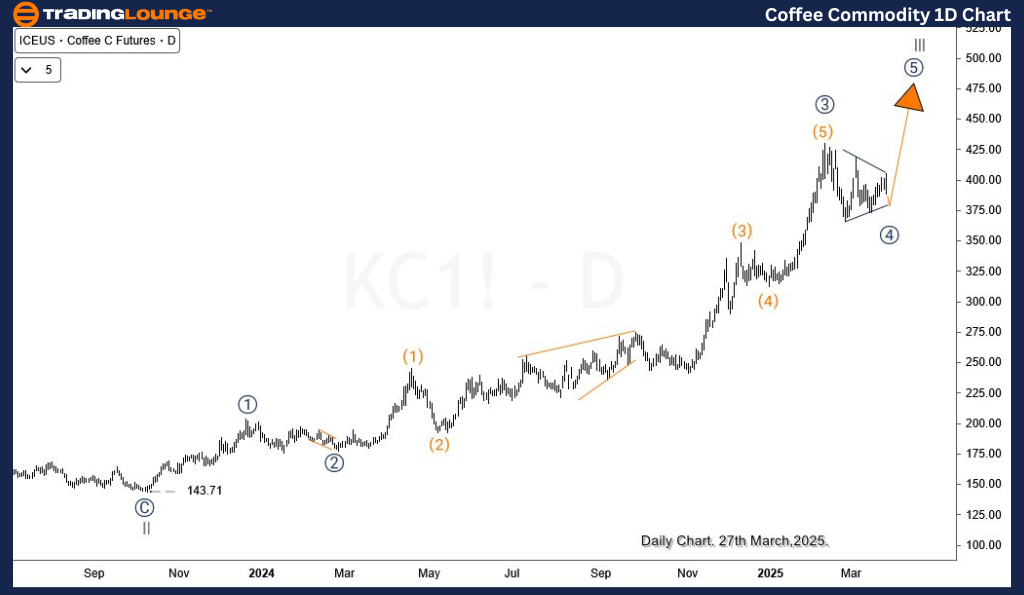
Coffee Daily Chart Analysis
In January 2023, Coffee completed wave (II) of the super cycle. Following that, wave I and wave II of (III) ended in February 2023 and October 2023. After a 17-month rally, wave ((3)) of III peaked in February 2025, followed by a pullback forming wave ((4)), currently appearing as a triangle pattern. This pattern suggests one more rally to complete wave III, which should then lead to a stronger correction in wave IV. As long as the price stays above 373, the triangle formation remains valid, targeting a potential breakout toward the 480–500 range.
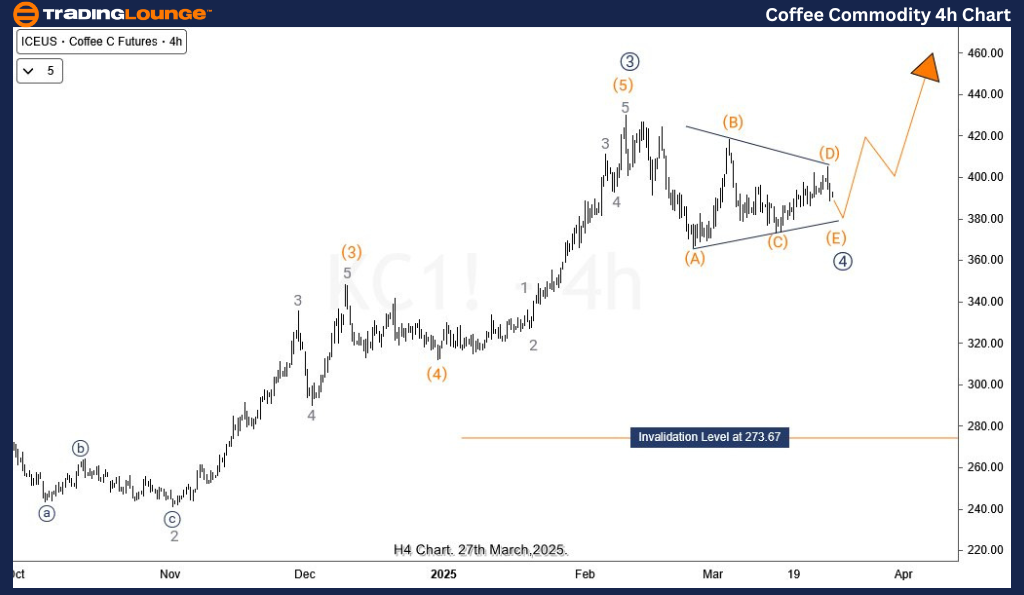
Coffee H4 Chart Analysis
The 4-hour chart confirms the triangle for wave ((4)) is near completion, with wave (E) forming above the key 373 support. Holding above this level supports the triangle structure. If prices fall below 373, wave ((4)) might shift into a double zigzag pattern, possibly targeting 353–313, before wave ((5)) can begin.
Technical Analyst: Sanmi Adeagbo
Source: Visit Tradinglounge.com and learn from the Experts Join TradingLounge Here
See Previous: Silver Elliott Wave Technical Analysis
VALUE Offer - Buy 1 Month & Get 3 Months!Click here
Access 7 Analysts Over 200 Markets Covered. Chat Room With Support