16Apr

VanEck Rare Earth & Strategic Metals ETF – REMX Elliott Wave Technical Analysis Shows Bullish Wave 4 Zigzag Correction With Target at $57.12

VanEck Rare Earth & Strategic Metals ETF – REMX (1D) Elliott Wave Analysis

REMX Daily Chart Analysis

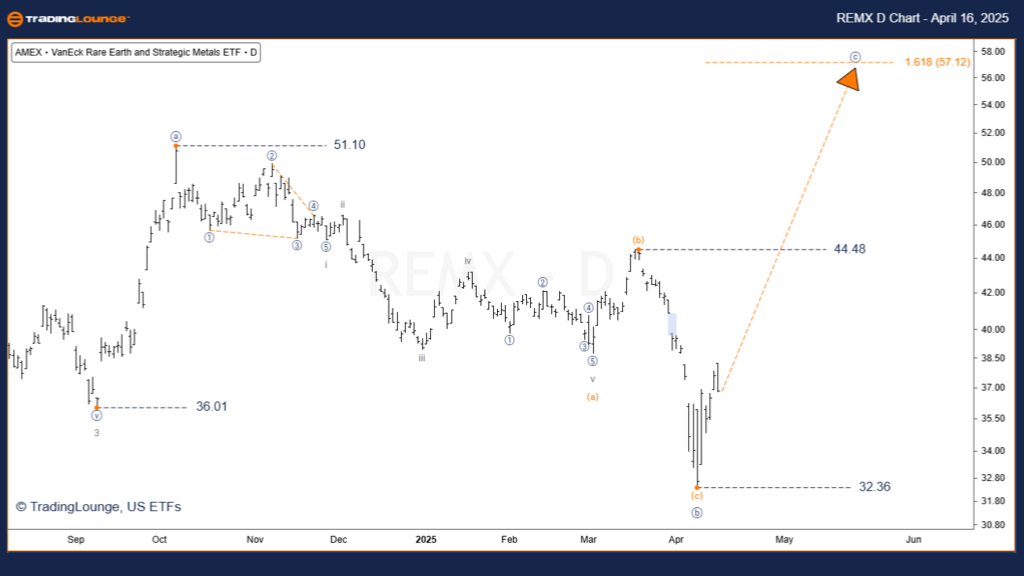
Market Function: Countertrend

Wave Mode: Corrective

Pattern Structure: Zigzag

Wave Position: Wave [c] of 4

Short-Term Trend: Bear Market Rally

Critical Invalidation Level: $32.36

Elliott Wave Analysis Summary:
The VanEck Rare Earth & Strategic Metals ETF (REMX) is unfolding a corrective wave 4 pattern, currently developing its final subwave. This wave 4 is expected to retrace between 38.2% and 50% of the preceding wave 3 decline, aligning with a classic zigzag formation. Confirmation of this expanded flat correction will occur if the price breaks above the $51.10 high.

Based on Fibonacci projections and wave symmetry, wave 4 is likely to complete around the $57.12 resistance area. Once wave 4 concludes, the broader downtrend is anticipated to resume with wave 5, potentially driving the ETF price below the start of wave 4. Traders and investors should track price action closely as the corrective phase nears exhaustion.

REMX-1d-etf-chart-16...


VanEck Rare Earth & Strategic Metals ETF – REMX (4H) Elliott Wave Analysis

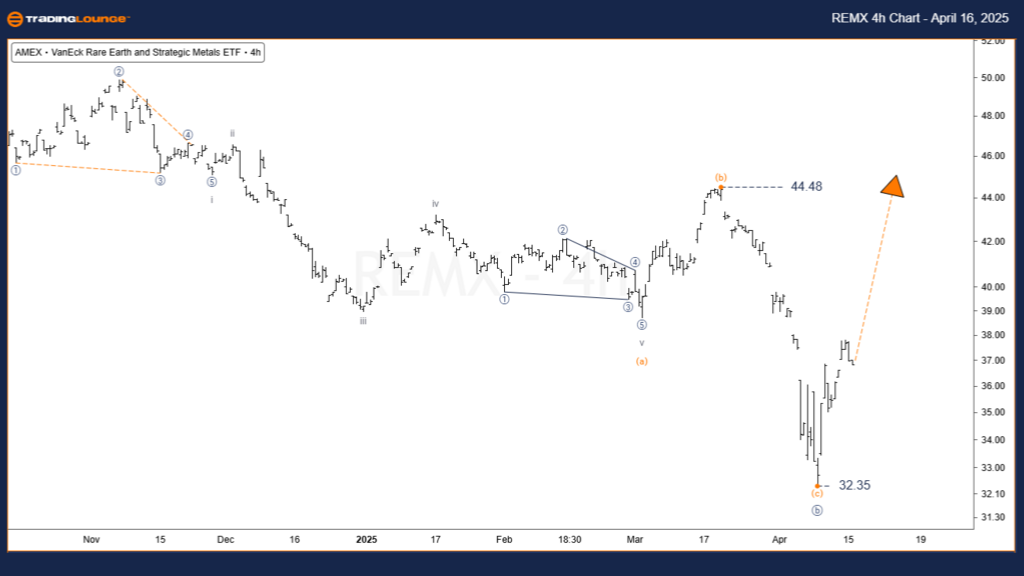
Market Function: Major Trend (Minor Degree)

Wave Mode: Motive

Pattern Structure: Impulse

Wave Position: Wave [c] (navy) of 4 (grey)

Short-Term Trend: Rally

Critical Invalidation Level: $32.35

Short-Term Elliott Wave Forecast:
REMX’s 4-hour chart suggests a strong impulsive advance in wave [c], completing the corrective wave 4 structure. This final leg of the rally is targeting a break above the $51.10 high and could stretch further toward the wave [a] peak. Bullish momentum is building rapidly, suggesting further upside in the near term.

Technical Analyst: Siinom

Source: Visit Tradinglounge.com and learn from the Experts. Join TradingLounge Here 

See Previous: VanEck Gold Miners ETF – GDX Elliott Wave Technical Analysis

VALUE Offer - Buy 1 Month & Get 3 Months!Click here

Access 7 Analysts Over 200 Markets Covered. Chat Room With Support

REMX-4h-etf-chart-16...


REMX ETF Elliott Wave Conclusion:

The REMX ETF is entering a bullish short-to-medium term phase, driven by the final stages of wave 4. The target range of $51.10 to $57.12 presents a potential opportunity for long positions. Traders should closely monitor price developments and maintain awareness of the key invalidation levels to mitigate downside risk. This Elliott Wave setup provides strategic insights for navigating REMX’s next market move.

Related

South32 Limited Stock Analysis & Elliott Wave Technical Forecast: Critical Validation Points and Includes a Short-Term Forecast

South32 Limited Stock Analysis & Elliott Wave Technical Forecast: Critical Validation Points and Includes a Short-Term Forecast

This analysis provides an in-depth look at ASX: South32 Limited (S32) using Elliott Wave theory. It ...

Read More >
NEOUSD Elliott Wave Analysis: NEO Trading Strategy, Fibonacci Support Forecast, and Crypto Market Trends for Smart Traders

NEOUSD Elliott Wave Analysis: NEO Trading Strategy, Fibonacci Support Forecast, and Crypto Market Trends for Smart Traders

NEOUSD Elliott Wave analysis, Fibonacci support levels, and swing trading strategies to forecast pri...

Read More >
Visa Inc.Stocks Analysis: Visa Inc. (V) Elliott Wave Technical Analysis By examining daily and 4-hour charts

Visa Inc.Stocks Analysis: Visa Inc. (V) Elliott Wave Technical Analysis By examining daily and 4-hour charts

This comprehensive Elliott Wave analysis for Visa Inc. (V) offers detailed insights into the stock&#...

Read More >
Highlighting Trading Strategies and market trends.Bitcoin: Crypto Price News Today Elliott Wave Technical Analysis

Highlighting Trading Strategies and market trends.Bitcoin: Crypto Price News Today Elliott Wave Technical Analysis

This article provides an in-depth Elliott Wave analysis of Bitcoin (BTCUSD), highlighting trading st...

Read More >
British Pound/ U.S. Dollar (GBPUSD) Elliott Wave Analysis: Bullish Wave 3 Progression with Key Invalidation Level at 1.31425

British Pound/ U.S. Dollar (GBPUSD) Elliott Wave Analysis: Bullish Wave 3 Progression with Key Invalidation Level at 1.31425

The GBPUSD pair is exhibiting a bullish trend, currently in Wave 3 according to Elliott Wave analysi...

Read More >
COAL INDIA Elliott Wave Analysis Identifies Correction Phase and Predicts Next Bearish Trend Using Technical Trading Strategy

COAL INDIA Elliott Wave Analysis Identifies Correction Phase and Predicts Next Bearish Trend Using Technical Trading Strategy

COAL INDIA’s corrective wave pattern using Elliott Wave principles, identifying a short-term retrac...

Read More >

Buy 1 Month

Get 3 Months!

Special Offer:

Trade Recommendations

Unleash the power of deversified trading with our comprehensive portfolio, covering:

  • Stock Trades
  • Crypto Trades
  • Forex Trades
  • Commodity Trades
Elliott Wave Analysis

Gain a competive edge with expert insights in to:

  • Global Indices
  • US Stocks & ASX Stocks
  • Forex & Crypto
  • Commodities
Top-Notch Trading Tools

Equip yourself with the tools of success:

  • Social Chat
  • Elliott Wave Algorithm
  • Screener
  • TradingLevels
  • Trading Game
7 Elliott Wave Analysts

Stay ahead of the market with daily charts and insightful videos
-Your secret to strategic trading!

JOIN HERE


Welcome to TradingLounge (ASIC A.R.No. 321187), specialists in trades, trading education and technical analysis, covering stocks, indices, commodities, forex and cryptocurrencies.

When you join TradingLounge you have access to everything we offer, including trade tools, educational content and a social platform to chat with like-minded investors.

Read more

@Copyright 2024 by tradinglounge.com

Contact Us

Australian no: 02 4787 6020

International no: +61 (2) 47876020

Pay with:

Find us on