01Aug

Soybeans Commodity Elliott Wave Technical Analysis Provides Insights into the Ongoing Downtrend and Potential market trends,

Soybeans Commodity Elliott Wave Analysis

Soybean Elliott Wave Technical Overview

Soybean prices have reached their lowest levels since September 2020, continuing a prolonged downtrend that started in June 2022. The latest decline began in May 2024, wiping out the gains made between February and March 2024. While a short-term corrective bounce may occur, the overall outlook suggests that soybeans are likely to continue their downward trend in the coming months.

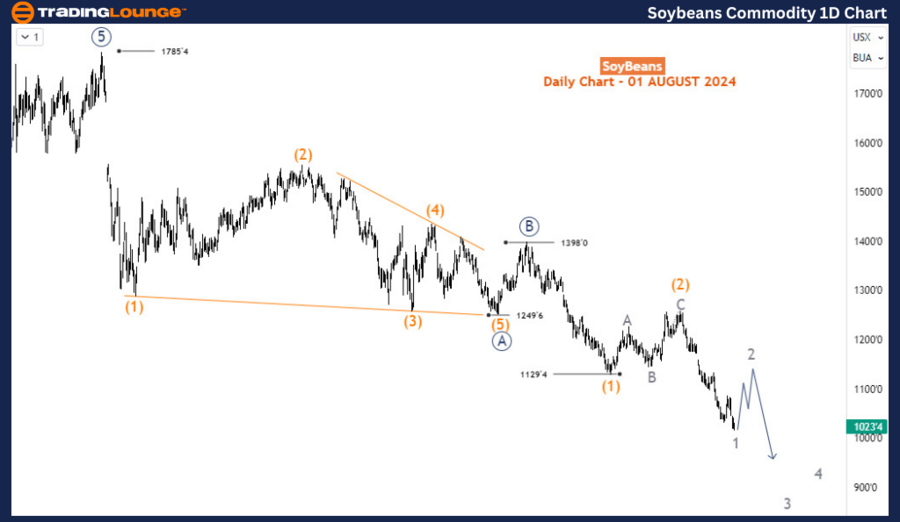
Soybeans Daily Chart Analysis

The daily chart shows a significant bullish impulse wave starting in May 2019, peaking at 1785 in June 2022. Since then, prices have entered a corrective phase, adjusting the long-term upward trend. This decline from the 1785 peak follows a zigzag A-B-C (circled) pattern. Waves A and B (circled) were completed at 1249 (October 2023 low) and 1398 (November 2023 high), respectively. Wave C (circled) is currently unfolding downward, with waves (1) and (2) of 5 (circled) already formed, and wave 1 of (3) now in progress. The price is approaching the critical 1,000 level as it works to complete wave 1 of (3). A corrective move for wave 2 of (3) is anticipated soon.

Soybeans-Commodity-1...


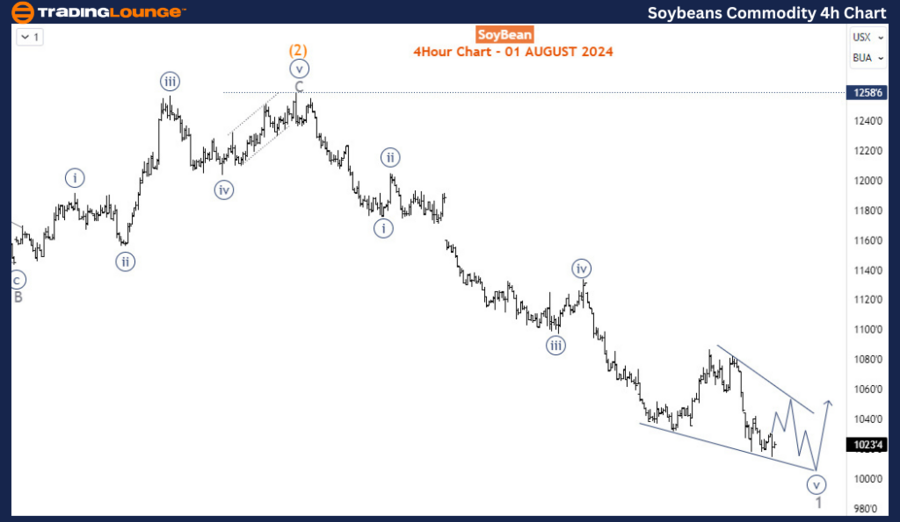
Soybeans 4-Hour Chart Analysis

The H4 chart suggests wave 1 is nearing the completion of an impulsive wave pattern, with the 5th sub-wave possibly forming an ending diagonal, which could indicate a reversal. Before any significant movement, a bullish confirmation for wave 2 is needed. The ideal trading strategy at this point is to wait for wave 2 to finish, then look for SHORT opportunities as wave 3 of (3) begins, provided the 1288 wave (2) high remains unbroken.

Conclusion

In conclusion, the Elliott Wave analysis of soybeans indicates that, despite the possibility of a short-term corrective bounce, the prevailing bearish trend is expected to continue. Traders should be on the lookout for SHORT opportunities following the expected wave 2 correction, especially around the key 1,000 level. The larger downtrend remains intact, and the completion of the current wave pattern will provide further insights into the commodity's future direction.

Technical Analyst: Sanmi Adeagbo

Source: visit Tradinglounge.com and learn From the Experts Join TradingLounge Here 

See Previous: Silver (XAGUSD) Elliott Wave Technical Analysis

Soybeans-Commodity-4...

Related

ASX SHL Stock Analysis: Sonic Healthcare Limited Elliott Wave Technical Analysis, Price Target Insights & Price Target

ASX SHL Stock Analysis: Sonic Healthcare Limited Elliott Wave Technical Analysis, Price Target Insights & Price Target

This report provides an in-depth Elliott Wave analysis of ASX: SHL (Sonic Healthcare Limited), inclu...

Read More >
V300AEQ ETF UNITS – VAS Stock Analysis & Vanguard Elliott Wave Technical Forecast

V300AEQ ETF UNITS – VAS Stock Analysis & Vanguard Elliott Wave Technical Forecast

Our latest Elliott Wave analysis on ASX: V300AEQ ETF Units – VAS reveals that wave 2-red has conclu...

Read More >
Detailed Insights into the Palo Alto Networks Inc.Stock Performance: PANW Stocks Elliott Wave Technical Analysis

Detailed Insights into the Palo Alto Networks Inc.Stock Performance: PANW Stocks Elliott Wave Technical Analysis

Our latest Elliott Wave analysis of Palo Alto Networks Inc. (PANW) offers detailed insights into the...

Read More >
Britannia Industries Stock Forecast & Elliott Wave Technical Analysis – Price Targets & Trading Strategies

Britannia Industries Stock Forecast & Elliott Wave Technical Analysis – Price Targets & Trading Strategies

Britannia Industries has shown promising momentum with bullish patterns reflected through Elliott Wa...

Read More >
KOSPI Composite Index Elliott Wave Technical Analysis: Bullish Wave 3 Forecast & Trading Strategy for South Korea’s Stock Market

KOSPI Composite Index Elliott Wave Technical Analysis: Bullish Wave 3 Forecast & Trading Strategy for South Korea’s Stock Market

This article offers a detailed Elliott Wave analysis of the KOSPI Composite Index, highlighting a bu...

Read More >
HCL Technologies Elliott Wave Analysis - HCLTECH Stock Forecast, Technical Trends, Wave Structure, and Market Outlook

HCL Technologies Elliott Wave Analysis - HCLTECH Stock Forecast, Technical Trends, Wave Structure, and Market Outlook

HCL Technologies Elliott Wave Analysis, highlighting potential stock movements, price predictions, a...

Read More >

$1 for 2 Weeks

then $29 a month!

What a Special Offer!

Trade Recommendations

Unleash the power of deversified trading with our comprehensive portfolio, covering 250+ markets:

  • Stock Trades
  • Crypto Trades
  • Forex Trades
  • Commodity Trades
Elliott Wave Analysis

Gain a competitive edge with expert insights and AI-powered Elliott Wave charting into:

  • Global Indices
  • US Stocks & ASX Stocks
  • Forex & Crypto
  • Commodities
Top-Notch Trading Tools

Equip yourself with the tools of success:

  • Real-time Chat rooms
  • Elliott Wave Algorithm
  • Portfolio tools
  • TradingLevels
  • Screener
  • Trading Game
7 Elliott Wave Analysts

Stay ahead of the market with daily charts and insightful videos
Your secret to strategic trading!

JOIN HERE


Welcome to TradingLounge (ASIC A.R.No. 321187), specialists in trades, trading education and technical analysis, covering stocks, indices, commodities, forex and cryptocurrencies.

When you join TradingLounge you have access to everything we offer, including trade tools, educational content and a social platform to chat with like-minded investors.

Read more

@Copyright 2024 by tradinglounge.com

Contact Us

Australian no: 02 4787 6020

International no: +61 (2) 47876020

Pay with:

Find us on