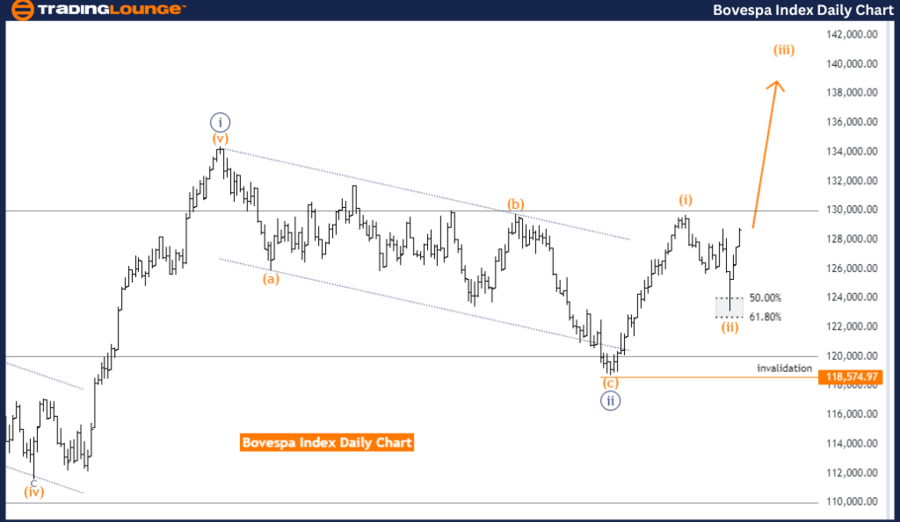
Bovespa Index Elliott Wave Analysis - Trading Lounge Day Chart
Bovespa Index Elliott Wave Technical Analysis
FUNCTION: Trend
MODE: Impulsive
STRUCTURE: Orange wave 3
POSITION: Navy Blue Wave 3
DIRECTION NEXT HIGHER DEGREES: Orange wave 3 (initiated)
DETAILS: The analysis indicates that orange wave 2 is likely completed, and orange wave 3 of 3 is now in progress. The invalidation level is established at 118574.97.
The Bovespa Index's Elliott Wave Analysis on the daily chart demonstrates a strong impulsive trend, signaling robust upward momentum. The current focus is on orange wave 3, which signifies a key upward movement within the broader impulsive wave structure.
The market is currently positioned within navy blue wave 3, indicating that the upward trend is developing as expected. This movement aligns with the ongoing progression of orange wave 3. The direction for the next higher degrees is consistent with the initiation of orange wave 3, further affirming the bullish trend.
The analysis highlights that orange wave 2 has likely ended, concluding the corrective phase within this wave structure. This completion is significant, setting the stage for orange wave 3 of 3, which is anticipated to propel the market further upward. The transition from orange wave 2 to orange wave 3 marks a shift from consolidation to a more aggressive upward trajectory.
The invalidation level, set at 118574.97, is a critical point of reference. If the market drops below this level, the current wave structure would be invalidated, suggesting that the anticipated upward movement is not unfolding as predicted. This would necessitate a reevaluation of the wave count and the overall market outlook.
Summary:
The Bovespa Index's Elliott Wave Analysis on the daily chart underscores a strong upward trend within an impulsive wave structure. The market is positioned within navy blue wave 3, with orange wave 2 completed and orange wave 3 of 3 now in progress. The invalidation level at 118574.97 is vital for confirming this analysis.
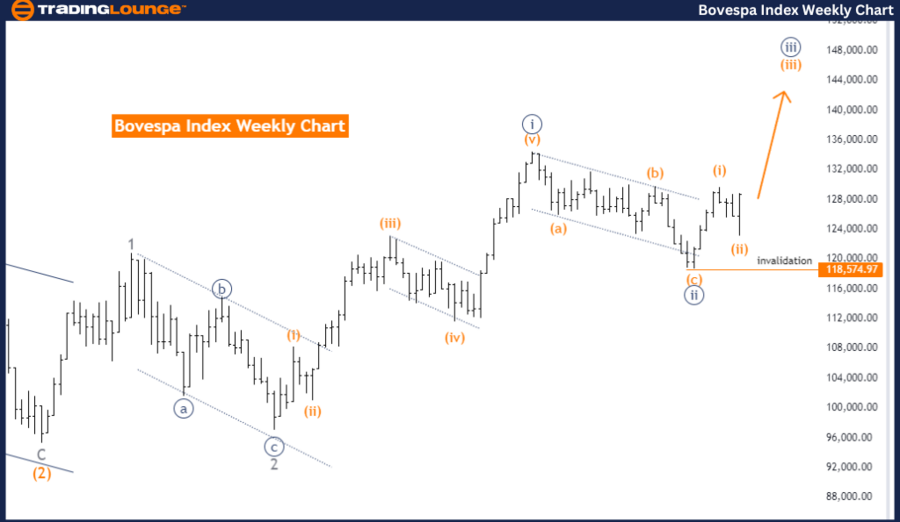
Bovespa Index Elliott Wave Analysis - Trading Lounge Weekly Chart
Bovespa Index Elliott Wave Technical Analysis
FUNCTION: Trend
MODE: Impulsive
STRUCTURE: Orange wave 3
POSITION: Navy Blue Wave 3
DIRECTION NEXT HIGHER DEGREES: Orange wave 3 (initiated)
DETAILS:
The analysis suggests that orange wave 2 has likely concluded, and orange wave 3 of 3 is currently in motion. The invalidation level is set at 118574.97.
The Bovespa Index's Elliott Wave Analysis on the weekly chart shows a strong trend with an impulsive mode, indicating a powerful upward movement. The primary wave under review is orange wave 3, suggesting the market is in the midst of a sustained bullish phase.
The market is currently positioned within navy blue wave 3, confirming that the market is advancing within the larger orange wave 3, maintaining upward momentum typical of an impulsive wave. The direction for the next higher degrees aligns with the initiation of orange wave 3, reinforcing the ongoing upward trend.
The analysis indicates that orange wave 2 appears to be complete, ending the corrective phase within the broader wave structure. This completion paves the way for the development of orange wave 3 of 3. The shift into orange wave 3 of 3 is crucial as it represents the continuation and acceleration of the upward trend, with the market expected to rise further as this wave unfolds.
The invalidation level is identified at 118574.97. This level is critical for confirming the current wave structure; a drop below this point would invalidate the present analysis, indicating that the expected upward movement is not materializing. If invalidation occurs, a reassessment of the wave count and overall market outlook would be necessary.
Summary:
The Bovespa Index's Elliott Wave Analysis on the weekly chart emphasizes a strong and sustained upward trend within an impulsive wave structure. The market is advancing within navy blue wave 3, with orange wave 2 completed and orange wave 3 of 3 currently active. The invalidation level at 118574.97 is crucial for maintaining the validity of this bullish analysis.
Technical Analyst: Malik Awais
Source: visit Tradinglounge.com and learn From the Experts Join TradingLounge Here
See previous: IBEX 35 Elliott Wave Technical Analysis
Special Trial Offer - 0.76 Cents a Day for 3 Months! Click here
Access 7 Analysts Over 170 Markets Covered. Chat Room With Support