S&P 500 Elliott Wave Analysis | Trading Lounge Daily Chart
S&P 500 Elliott Wave Technical Analysis – Daily Timeframe
FUNCTION: Bullish Trend
MODE: Impulsive
STRUCTURE: Navy Blue Wave 1
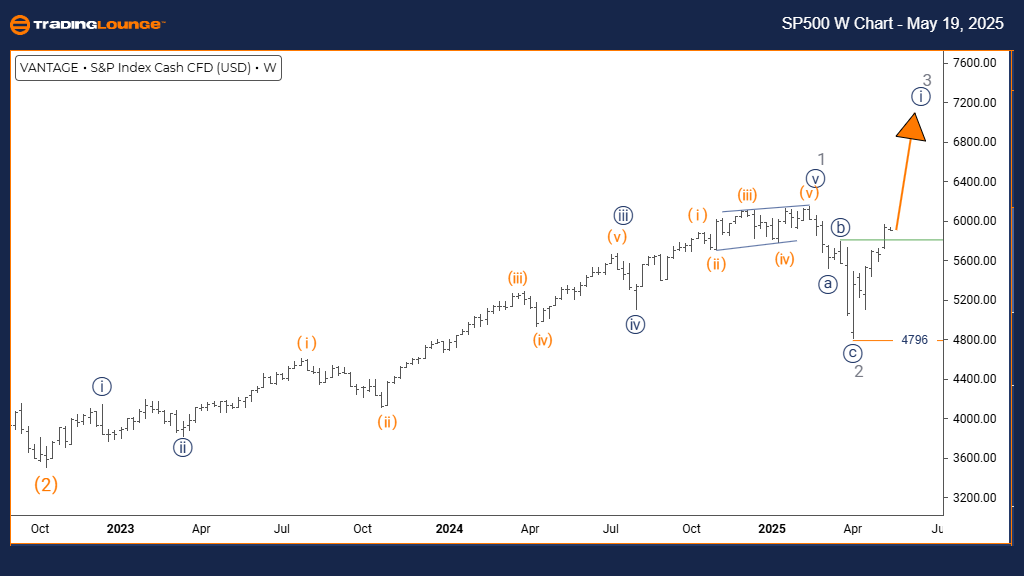
POSITION: Gray Wave 3
DIRECTION NEXT LOWER DEGREES: Navy Blue Wave 2
DETAILS: Completion of Gray Wave 2 identified; Navy Blue Wave 1 of 3 is actively progressing.
Wave Invalidation Level: 4796
The S&P 500 daily Elliott Wave chart signals a robust bullish impulse wave, as navy blue wave 1 initiates within the broader gray wave 3 structure. Following the confirmed completion of gray wave 2, the market now transitions into a stronger upward move, suggesting sustained bullish sentiment.
Analysis of the wave count indicates that gray wave 2 has finalized, and navy blue wave 1 is now underway. A decisive break below 4796 would invalidate the bullish wave count, hinting at a deeper retracement or potential trend reevaluation. Present momentum supports the narrative of institutional buying power driving this rally.
Looking forward, traders should anticipate navy blue wave 2, a corrective sequence that typically follows a strong impulsive leg. This wave setup offers a framework to align with the dominant bullish market structure, as long as support remains firm above 4796.
S&P 500 Elliott Wave Analysis | Trading Lounge Weekly Chart
S&P 500 Elliott Wave Technical Analysis – Weekly Timeframe
FUNCTION: Bullish Trend
MODE: Impulsive
STRUCTURE: Navy Blue Wave 1
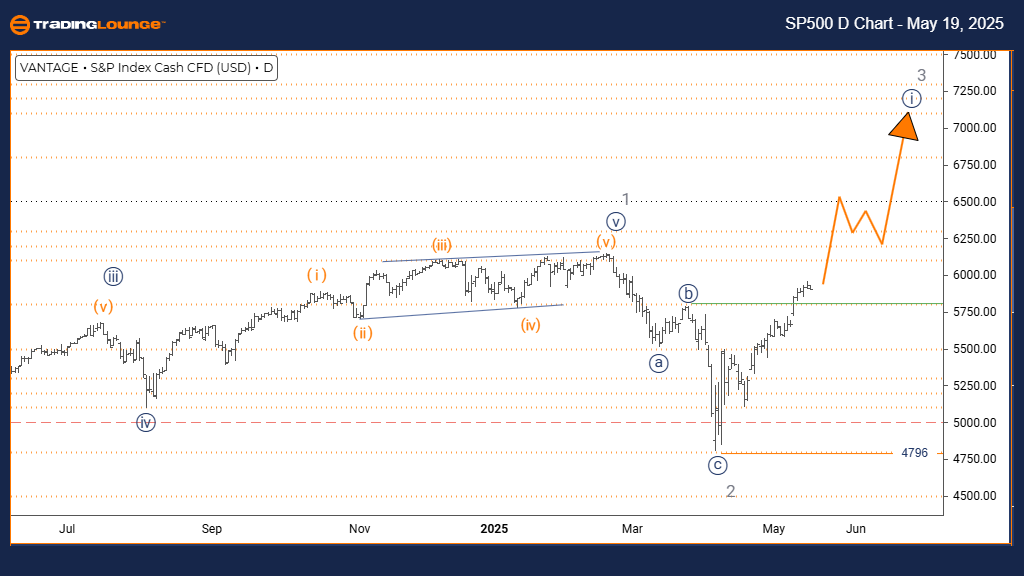
POSITION: Gray Wave 3
DIRECTION NEXT LOWER DEGREES: Navy Blue Wave 2
DETAILS: Completion of Gray Wave 2 confirmed; Navy Blue Wave 1 of 3 is developing.
Wave Invalidation Level: 4796
The S&P 500 weekly Elliott Wave outlook reaffirms a strong impulsive bullish trend, highlighting navy blue wave 1 forming within a broader gray wave 3. The structure confirms gray wave 2 has completed, and a bullish impulse wave has initiated, likely offering room for significant gains before a corrective phase begins.
This transition from gray wave 2 to navy blue wave 1 presents a textbook Elliott Wave scenario. Continued movement above 4796 strengthens the bullish case, while a breach below that level could indicate the need for count adjustment or suggest a deeper market correction.
This stage of wave development is often the most aggressive in bullish Elliott Wave cycles, providing strategic opportunities for swing traders and investors. Price action should be monitored closely for signs of ongoing strength or trend exhaustion.
Technical Analyst: Malik Awais
Source: Visit Tradinglounge.com and learn from the Experts. Join TradingLounge Here
Previous: S&P/TSX 60 Elliott Wave Technical Analysis
VALUE Offer - Buy 1 Month & Get 3 Months!Click here
Access 7 Analysts Over 200 Markets Covered. Chat Room With Support