S&P/TSX 60 Elliott Wave Analysis | Trading Lounge Daily Chart
S&P/TSX 60 Technical Forecast Using Elliott Wave Theory
FUNCTION: Bullish Market Trend
MODE: Impulsive Elliott Wave
STRUCTURE: Orange Wave 1 Formation
POSITION: Developing Navy Blue Wave 3
DIRECTION NEXT LOWER DEGREES: Anticipating Orange Wave 2
DETAILS: Navy Blue Wave 2 has likely concluded; Orange Wave 1 of 3 is in progress.
The S&P/TSX 60 daily chart indicates an ongoing bullish Elliott Wave formation, with an impulsive structure suggesting strong upward momentum. Currently, Orange Wave 1 is forming as part of Navy Blue Wave 3, signifying the end of the corrective Navy Blue Wave 2 phase. This pattern implies that the index has entered a new growth leg, potentially leading to further gains.
This wave count reveals the transition into the first wave of a new impulse, with the market showing signs of strength. The current impulsive move supports a positive outlook, suggesting bullish continuation before a probable correction occurs. The next anticipated corrective move is Orange Wave 2, which would follow the peak of the ongoing rally.
Traders should closely track price behavior to confirm wave strength. Any reversal or slowdown may indicate that Wave 1 is near completion, setting the stage for Orange Wave 2. Technically, the market appears to be in a strong uptrend, likely to extend until signs of correction surface.

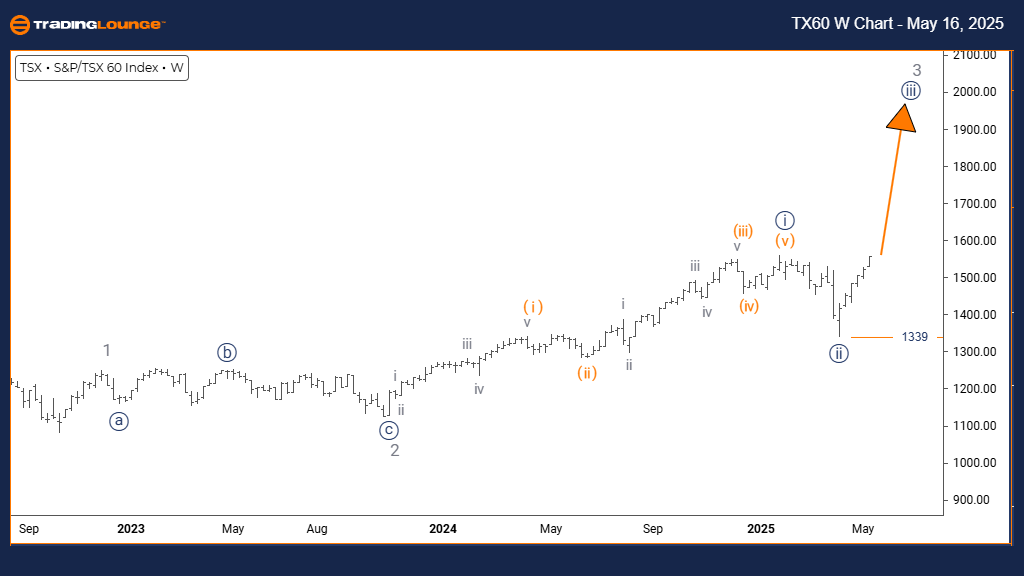
S&P/TSX 60 Elliott Wave Analysis | Trading Lounge Weekly Chart
Weekly Elliott Wave Forecast for S&P/TSX 60 Index
FUNCTION: Ongoing Bullish Trend
MODE: Impulsive Wave Structure
STRUCTURE: Advancing Navy Blue Wave 3
POSITION: Completing Gray Wave 2
DIRECTION NEXT HIGHER DEGREES: Orange Wave 3 Initiated
DETAILS: Navy Blue Wave 2 is complete; Wave 3 has started.
The weekly Elliott Wave chart for S&P/TSX 60 supports a sustained bullish outlook, with a clear impulsive structure developing. The market is advancing in Navy Blue Wave 3, following the completion of Gray Wave 2. This transition marks the end of the recent correction and the onset of a stronger upward move.
With Wave 2 finalized and Wave 3 active, institutional buying may be increasing. From a technical standpoint, this reinforces the long-term bullish cycle, where the current wave can show significant price appreciation. This phase within Gray Wave 2 provides critical context for understanding the broader Elliott Wave positioning.
This chart offers a strategic view of the index's long-term cycle. Since Wave 3 in Elliott Wave theory is typically the strongest, continued bullish action is expected. Market watchers should monitor momentum and price behavior for validation or early signals of reversal.
In summary, this Elliott Wave forecast helps traders manage entries and exits during an extended uptrend. The market’s wave structure indicates potential upside continuation, but maintaining alertness for early signs of weakness remains essential.
Technical Analyst: Malik Awais
Source: Visit Tradinglounge.com and learn from the Experts. Join TradingLounge Here
Previous: DAX (Germany) Elliott Wave Technical Analysis
VALUE Offer - Buy 1 Month & Get 3 Months!Click here
Access 7 Analysts Over 200 Markets Covered. Chat Room With Support