Wheat Elliott Wave Technical Analysis - 23 February 24

Explore the latest Elliott Wave analysis for Wheat, shedding light on its current trajectory and potential future movements. Despite recent bounces, indications point towards a continuation of the bearish trend. Let's delve into the intricacies of our analysis.

Key Points:

  • Analysis reveals a corrective, counter-trend movement within Wheat's price action.
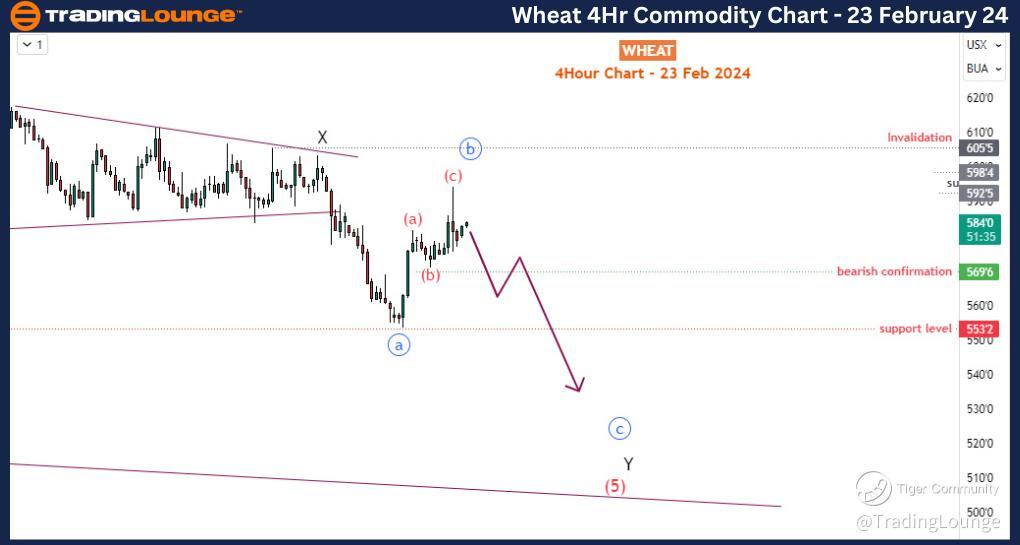
  • The structure is identified as a Zigzag pattern, with the current position indicating Blue wave 'b' of black wave Y.
  • Anticipated direction suggests a move towards Blue Wave 'c' of black wave Y, targeting significant support levels.

Elliott Wave Perspective: Analyzing Wheat through the lens of Elliott wave theory unveils insights into its price dynamics. Despite recent bounces, the overarching bearish trend remains dominant, tracing back to March 2022.

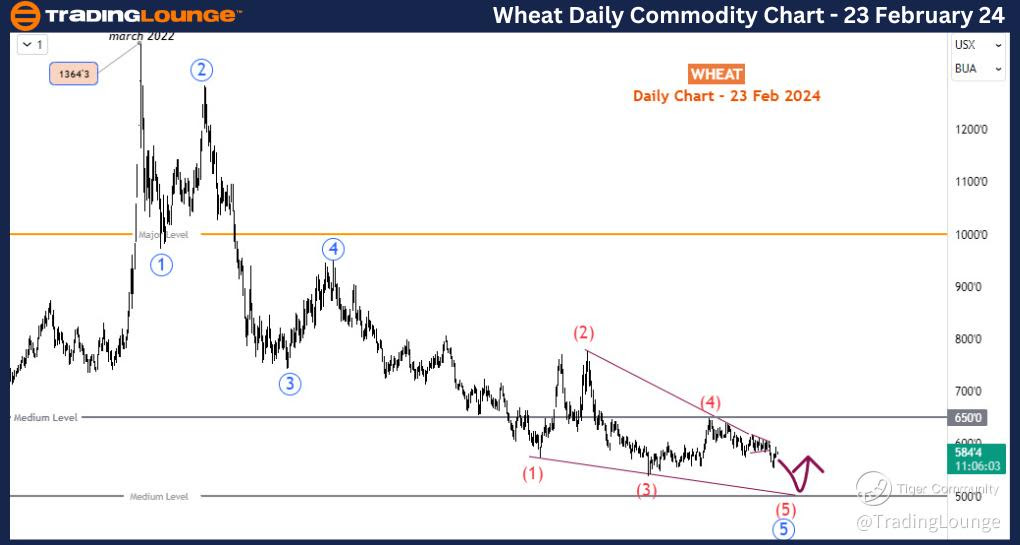
Daily Timeframe Analysis: A comprehensive examination of the daily timeframe illustrates a prolonged bearish trend, characterized by a clear impulse wave pattern. The current pattern nearing completion of its 5th wave through an ending diagonal suggests a potential bottoming out. Confirmation awaits a breach above the crucial 650 medium level. Failure to breach could signify further downside towards the 500 medium level.

Wheat-Day-commodity-...


4-Hour Timeframe Insights: Transitioning to the H4 timeframe reveals a double zigzag bearish move, initiated at the 650 medium level. Wave X concluded as a triangle pattern before confirming the onset of wave Y. With wave Y expected to unfold in 3 waves, a sharp decline towards 530 or lower is anticipated with the initiation of blue sub-wave 'c'. Confirmation and invalidation levels are established to refine trading strategies accordingly.

Technical Analyst: Sanmi Adeagbo

Source: visit Tradinglounge.com and learn From the Experts Join TradingLounge Here 

See Previous: Iron Ore

Wheat-4hr-commodity-...

Conclusion: The Elliott Wave analysis of Wheat highlights the prevailing bearish sentiment, despite recent corrective movements. Traders and investors can leverage this analysis to navigate potential price fluctuations and make informed decisions in the market.

Related

FTSE 100 Elliott Wave Technical Analysis: Market Trends, Price Prediction, Wave Count, and Trading Strategy for UK Stock Market

FTSE 100 Elliott Wave Technical Analysis: Market Trends, Price Prediction, Wave Count, and Trading Strategy for UK Stock Market

FTSE 100 Elliott Wave Analysis provides a detailed forecast based on wave theory, helping traders na...

Read More >
Australian Dollar/U.S. Dollar (AUDUSD) Elliott Wave Analysis: Accurate Currency Forecasts and Forex Technical Insights

Australian Dollar/U.S. Dollar (AUDUSD) Elliott Wave Analysis: Accurate Currency Forecasts and Forex Technical Insights

The AUDUSD Elliott Wave analysis provides a detailed look at the current market trends, focusing on ...

Read More >
Looking to Invest in Nikkei 225 ETFs, Index Funds, or Individual Stocks: N225 Index Elliott Wave Technical Analysis

Looking to Invest in Nikkei 225 ETFs, Index Funds, or Individual Stocks: N225 Index Elliott Wave Technical Analysis

Stay ahead in the Nikkei 225 market with expert trading insights and analysis. This comprehensive gu...

Read More >
NIFTY 50(INDIA) Index Elliott Wave Technical Analysis Provides Detailed Insights into current market trends

NIFTY 50(INDIA) Index Elliott Wave Technical Analysis Provides Detailed Insights into current market trends

The NIFTY 50 (India) Elliott Wave Analysis provides detailed insights into current market trends usi...

Read More >
Cochlear Limited COH Elliott Wave Analysis Reveals Wave 3 Rally With $350 Target, $246.52 Invalidation & Medium‑Term Outlook

Cochlear Limited COH Elliott Wave Analysis Reveals Wave 3 Rally With $350 Target, $246.52 Invalidation & Medium‑Term Outlook

This Elliott Wave analysis shows Cochlear Limited (COH) has likely completed Wave 2 and begun a powe...

Read More >
S&P BSE Sensex Elliott Wave Analysis: Trading Strategies & Price Predictions for Smart Investors and Traders in the Indian Stock Market

S&P BSE Sensex Elliott Wave Analysis: Trading Strategies & Price Predictions for Smart Investors and Traders in the Indian Stock Market

This S&P BSE Sensex Elliott Wave Analysis provides an in-depth look at the current market trend, wav...

Read More >

$1 for 2 Weeks

then $29 a month!

What a Special Offer!

Trade Recommendations

Unleash the power of deversified trading with our comprehensive portfolio, covering 250+ markets:

  • Stock Trades
  • Crypto Trades
  • Forex Trades
  • Commodity Trades
Elliott Wave Analysis

Gain a competitive edge with expert insights and AI-powered Elliott Wave charting into:

  • Global Indices
  • US Stocks & ASX Stocks
  • Forex & Crypto
  • Commodities
Top-Notch Trading Tools

Equip yourself with the tools of success:

  • Real-time Chat rooms
  • Elliott Wave Algorithm
  • Portfolio tools
  • TradingLevels
  • Screener
  • Trading Game
7 Elliott Wave Analysts

Stay ahead of the market with daily charts and insightful videos
Your secret to strategic trading!

JOIN HERE


Welcome to TradingLounge (ASIC A.R.No. 321187), specialists in trades, trading education and technical analysis, covering stocks, indices, commodities, forex and cryptocurrencies.

When you join TradingLounge you have access to everything we offer, including trade tools, educational content and a social platform to chat with like-minded investors.

Read more

@Copyright 2024 by tradinglounge.com

Contact Us

Australian no: 02 4787 6020

International no: +61 (2) 47876020

Pay with:

Find us on