Iron Ore Elliott wave Analysis: bullish impulse could resume.

Iron Ore Elliott Wave Technical Analysis

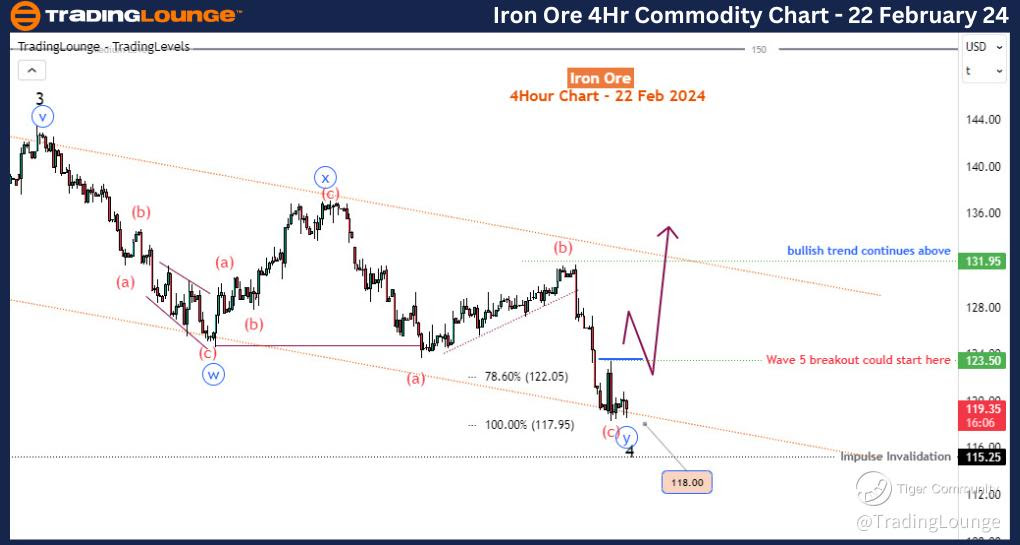
Function - Counter-trend

Mode - Corrective

Structure - Zigzag

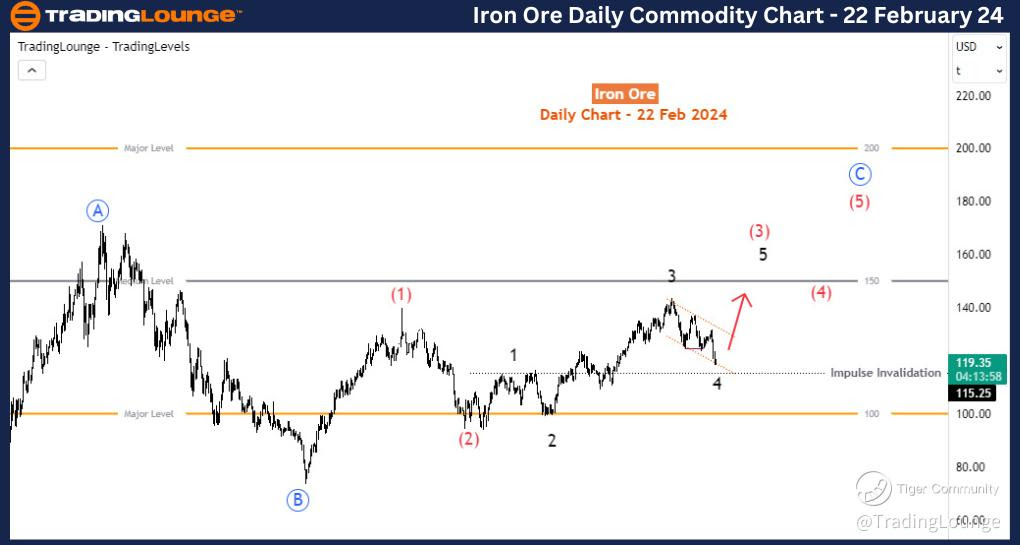
Position - Black wave 4 of higher degree red wave (5)D

Direction - Black wave 5 of higher degree red wave (5)

Details - After the bears dragged this commodity to the marked 122.05-117.95 Fib-zone, a significant bounce could lead to a recovery to 150.

The function of the present market movement is identified as counter-trend, indicative of a corrective phase within the larger Elliott Wave cycle. This correction on the H4 is structured as a zigzag pattern, denoted as the black wave 4 within the context of the higher degree red wave (5) of an impulse.

Our focus shifts toward the anticipated direction of the market, which is poised for the initiation of the black wave 5, constituting a crucial phase within the broader red wave (3) on the daily time frame.

A notable aspect of the current market dynamics is the recent downturn that saw the commodity retreat to the Fib-zone ranging from 122.05 to 117.95. This is a zigzag corrective pattern. The implication is that, amidst this bearish onslaught, we expect this zone to provide support for a significant rebound, paving the way for a recovery rally towards the 150 mark.

At present, our analysis revolves around the ongoing counting of the black impulse wave pattern, with particular attention directed toward the completion of the 4th wave. This impending wave completion heralds the onset of the highly anticipated wave 5 of (3), representing a prized opportunity within the Elliott Wave framework.

Critical to our analysis is the pivotal support level situated at 115.25. The rejection of further decline below this threshold would solidify the outlook for the impending wave 5 of (3), reinforcing the bullish sentiment. If this bearish correction stays above 115.2 and the price breaks above 123.5, renewed bullish interests for wave 5 of (3) could be assumed especially if the bullish response is swift. 

In summary, the present market conditions offer a nuanced landscape characterized by corrective movements within the framework of Elliott Wave theory. While the completion of the 4th wave sets the stage for the anticipated wave 5 of (3), traders are advised to monitor key support levels diligently. As such, astute observation coupled with a thorough understanding of Elliott Wave principles will be instrumental in navigating the complexities of the market as it unfolds.

Technical Analyst: Sanmi Adeagbo

Source: visit Tradinglounge.com and learn From the Experts Join TradingLounge Here 

See Previous:  Cocoa Commodity

Iron-Ore-Day-Commodi...


Iron-Ore-4h-Commodit...

Related

Australian Dollar / Japanese Yen(AUDJPY) Charts Elliott Wave Technical Analysis 26 October 23

Australian Dollar / Japanese Yen(AUDJPY) Charts Elliott Wave Technical Analysis 26 October 23

In summary, the AUD/JPY Elliott Wave Analysis for 26 October 23, provides valuable information for t...

Read More >
In-depth look at the EUR/GBP Currency Pair using the Elliott Wave Theory: Insights into Potential Forex Market Movements

In-depth look at the EUR/GBP Currency Pair using the Elliott Wave Theory: Insights into Potential Forex Market Movements

This analysis provides an in-depth look at the EUR/GBP currency pair using the Elliott Wave theory. ...

Read More >
Comprehensive Perspective on NVIDIA Corp. Stock Market Behavior With Detailed NVDA Elliott Wave Technical Analysis

Comprehensive Perspective on NVIDIA Corp. Stock Market Behavior With Detailed NVDA Elliott Wave Technical Analysis

Our detailed Elliott Wave analysis for NVIDIA Corp (NVDA) dated August 5, 2024, provides an in-depth...

Read More >
Elliott Wave Analysis Highlights: Navigating Commodity Market Trends with Confidence

Elliott Wave Analysis Highlights: Navigating Commodity Market Trends with Confidence

This summary highlights the key points from an Elliott Wave analysis update on commodity markets. Th...

Read More >
NIKKEI 225(N225) Indices Elliott Wave Technical Analysis: Breaks down both daily and weekly market movements

NIKKEI 225(N225) Indices Elliott Wave Technical Analysis: Breaks down both daily and weekly market movements

This detailed analysis of the NIKKEI 225 index through the lens of Elliott Wave theory breaks down b...

Read More >

Buy 1 Month

Get 3 Months!

Special Offer:

Trade Recommendations

Unleash the power of deversified trading with our comprehensive portfolio, covering:

  • Stock Trades
  • Crypto Trades
  • Forex Trades
  • Commodity Trades
Elliott Wave Analysis

Gain a competive edge with expert insights in to:

  • Global Indices
  • US Stocks & ASX Stocks
  • Forex & Crypto
  • Commodities
Top-Notch Trading Tools

Equip yourself with the tools of success:

  • Social Chat
  • Elliott Wave Algorithm
  • Screener
  • TradingLevels
  • Trading Game
7 Elliott Wave Analysts

Stay ahead of the market with daily charts and insightful videos
-Your secret to strategic trading!

JOIN HERE


Welcome to TradingLounge (ASIC A.R.No. 321187), specialists in trades, trading education and technical analysis, covering stocks, indices, commodities, forex and cryptocurrencies.

When you join TradingLounge you have access to everything we offer, including trade tools, educational content and a social platform to chat with like-minded investors.

Read more

@Copyright 2024 by tradinglounge.com

Contact Us

Australian no: 02 4787 6020

International no: +61 (2) 47876020

Pay with:

Find us on