Welcome to Our Latest Elliott Wave Analysis for Texas Instruments Inc. (TXN)

This comprehensive report examines TXN's price action using Elliott Wave Theory, offering insights to help traders identify potential trading opportunities based on current market trends and wave structures. We analyze both the daily and 1-hour charts to provide a well-rounded view of TXN’s market behavior.

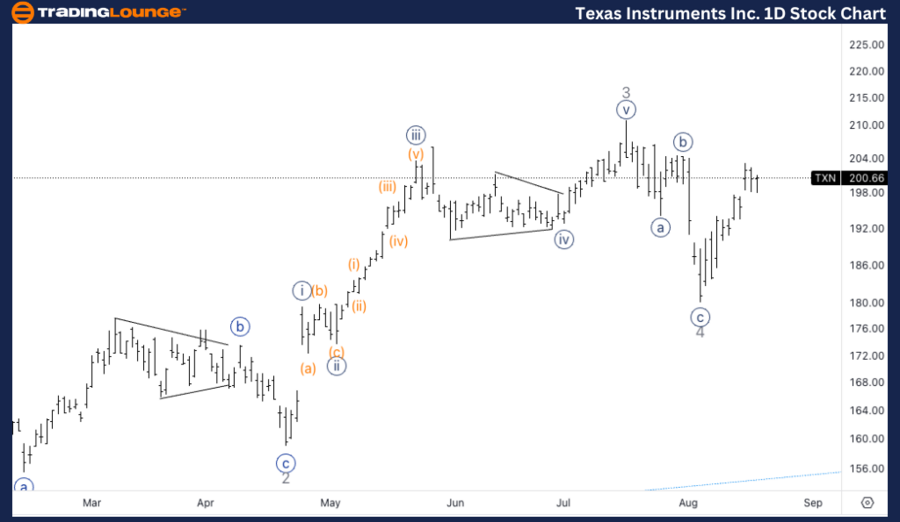
TXN Elliott Wave Analysis - TradingLounge Daily Chart

Texas Instruments Inc. (TXN) Daily Chart Analysis

TXN Elliott Wave Technical Analysis

Function: Trend

Mode: Impulsive

Structure: Motive

Position: Wave 5 of (1)

Direction: Upside in wave 5

Details: We observe a potential upside move into Minor wave 5, following a clear three-wave corrective move in wave 4. Since wave 3 was longer than wave 1, wave 5 could extend to the top of Minor Group 1 (MG1) at $230, with a possibility of reaching the Medium Level at $250 depending on the momentum strength.

TXN Stock Technical Analysis – Daily Chart

TXN is advancing in the final wave 5 of the current cycle, following a three-wave corrective structure in wave 4. With wave 3 surpassing the length of wave 1, wave 5 may extend toward significant resistance levels. The primary targets include the top of Minor Group 1 (MG1) at $230 and possibly further to the Medium Level at $250, contingent on the strength of the upward momentum.

Texas-Instruments-In...


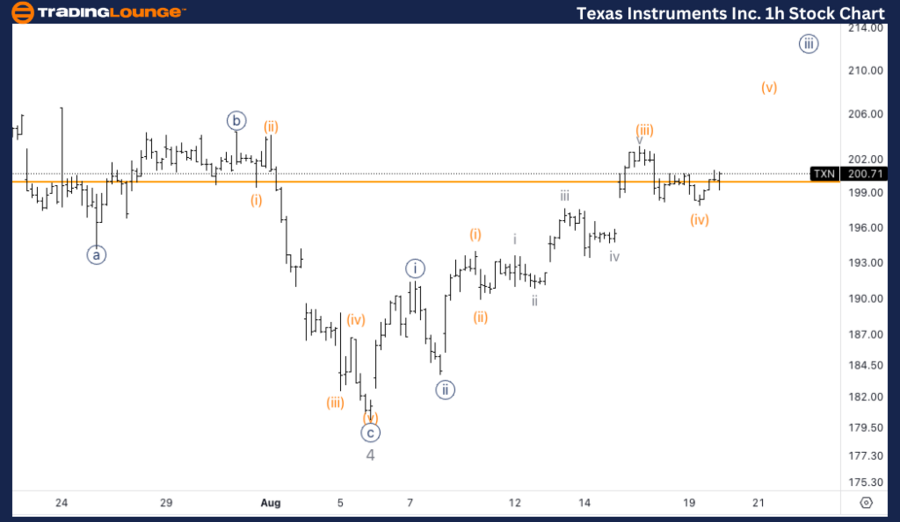
TXN Elliott Wave Analysis - TradingLounge 1H Chart

Texas Instruments Inc. (TXN) 1H Chart Analysis

Texas Instruments Inc TXN Stock Analysis

Function: Trend

Mode: Impulsive

Structure: Motive

Position: Wave {iii} of 5

Direction: Upside in wave {iii}

Details: The current labeling of wave {iii} suggests a conservative approach within Minor wave 5, as TXN appears to be extending higher. The recent pullbacks are likely corrective in nature, supporting continued bullish momentum. This wave structure indicates further upside potential as TXN completes wave {iii}, prepares for a correction in wave {iv}, and resumes higher in wave {v}.

TXN Elliott Wave Technical Analysis – 1H Chart

The labeling of wave {iii} suggests a methodical progression within Minor wave 5, as the stock continues to show signs of upward extension. The nature of the recent pullbacks, which appear corrective, supports the likelihood of continued bullish momentum. This wave structure implies further upside potential as TXN aims to complete wave {iii}, before eventually correcting in wave {iv} and resuming higher in wave {v}.

Technical Analyst: Alessio Barretta

Source: visit Tradinglounge.com and learn From the Experts Join TradingLounge Here 

See Previous: NVIDIA Corp. (NVDA) Elliott Wave Technical Analysis

Special Trial Offer - 0.76 Cents a Day for 3 Months! Click here

Access 7 Analysts Over 200 Markets Covered. Chat Room With Support

Texas-Instruments-In...

Related

Unlocking ASX Trading Success: NEWMONT CORPORATION – NEM Stock Analysis & Elliott Wave Technical Forecast

Unlocking ASX Trading Success: NEWMONT CORPORATION – NEM Stock Analysis & Elliott Wave Technical Forecast

Dive into our comprehensive Elliott Wave analysis for NEWMONT CORPORATION (NEM) on the Australian St...

Read More >
Elliott Wave Analysis: Bearish and Bullish Scenarios for SP 500 and Nasdaq 100

Elliott Wave Analysis: Bearish and Bullish Scenarios for SP 500 and Nasdaq 100

The Elliott Wave analysis of the SP 500 and Nasdaq 100 indices suggests a predominant bearish trend ...

Read More >
S&P BSE Sensex Elliott Wave Analysis – Market Trends, Corrective Phase, and Trading Signals for Daily & Weekly Charts

S&P BSE Sensex Elliott Wave Analysis – Market Trends, Corrective Phase, and Trading Signals for Daily & Weekly Charts

S&P BSE Sensex (India) Index provides insights into the current corrective phase and upcoming bullis...

Read More >
British Pound/Japanese Yen(GBPJPY) Elliott Wave Technical Analysis 16 January 24

British Pound/Japanese Yen(GBPJPY) Elliott Wave Technical Analysis 16 January 24

In summary, the GBPJPY Elliott Wave Analysis for the daily chart on 16 January 24, suggests that the...

Read More >
TASI Index Elliott Wave Technical Analysis: Detailed look at current market trends

TASI Index Elliott Wave Technical Analysis: Detailed look at current market trends

This analysis of the TASI Index using Elliott Wave theory provides a detailed look at current market...

Read More >
Soybeans Commodity Elliott Wave Technical Analysis Provides Insights into the Ongoing Downtrend and Potential market trends,

Soybeans Commodity Elliott Wave Technical Analysis Provides Insights into the Ongoing Downtrend and Potential market trends,

Explore in-depth Soybean Elliott Wave Analysis, covering recent price movements, Elliott Wave patter...

Read More >

Buy 1 Month

Get 3 Months!

Special Offer:

Trade Recommendations

Unleash the power of deversified trading with our comprehensive portfolio, covering:

  • Stock Trades
  • Crypto Trades
  • Forex Trades
  • Commodity Trades
Elliott Wave Analysis

Gain a competive edge with expert insights in to:

  • Global Indices
  • US Stocks & ASX Stocks
  • Forex & Crypto
  • Commodities
Top-Notch Trading Tools

Equip yourself with the tools of success:

  • Social Chat
  • Elliott Wave Algorithm
  • Screener
  • TradingLevels
  • Trading Game
7 Elliott Wave Analysts

Stay ahead of the market with daily charts and insightful videos
-Your secret to strategic trading!

JOIN HERE


Welcome to TradingLounge (ASIC A.R.No. 321187), specialists in trades, trading education and technical analysis, covering stocks, indices, commodities, forex and cryptocurrencies.

When you join TradingLounge you have access to everything we offer, including trade tools, educational content and a social platform to chat with like-minded investors.

Read more

@Copyright 2024 by tradinglounge.com

Contact Us

Australian no: 02 4787 6020

International no: +61 (2) 47876020

Pay with:

Find us on