23May

Binance Wave 3 Breakout: BNBUSD Elliott Wave Analysis and Trading Strategy with Fibonacci Targets and Risk Control Techniques

BNBUSD Elliott Wave Analysis – TradingLounge Daily Chart,

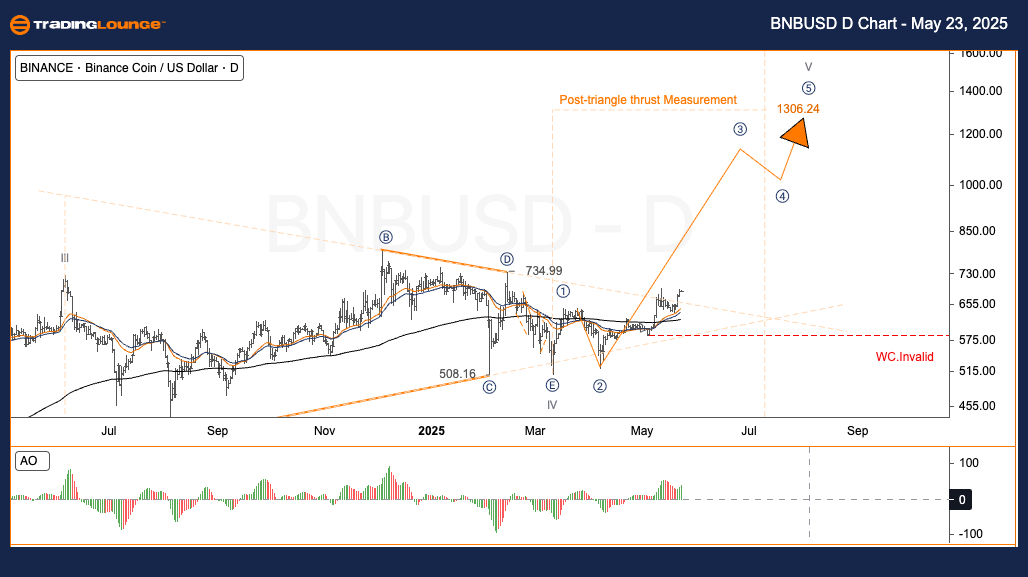
Binance / U.S. Dollar (BNBUSD) Daily Chart Analysis

BNBUSD Elliott Wave Technical Analysis

Function: Trend Continuation

Mode: Motive

Structure: Impulsive Wave

Current Wave Position: Advancing in Wave 3

Next Major Direction: Anticipated movement into Wave IV (Impulse Cycle)

Wave Invalidation Level: To be confirmed

BNBUSD Trading Strategy – Daily Chart Overview

BNBUSD has shown a strong bullish move after breaking out of a defined Triangle IV consolidation pattern. The clear breakout beyond the resistance trendline (E–D–C–B–A) indicates the beginning of Wave (3), typically the most powerful segment within an impulsive Elliott Wave cycle.

Binance Trading Opportunities

✅ For Swing Traders:

  • Monitor sub-wave 4 pullbacks within the ongoing Wave (3) for potential long entries.
  • Target Price Range: $1,306.24, aligned with the thrust projection following the triangle breakout.

🟥 Risk Management:

Recommended Stop Loss Zone: Between $605 and $625 to manage position risk amid market volatility.

BNBUSD-Day-Crypto-Ch...


Binance / U.S. Dollar Elliott Wave Analysis – TradingLounge H4 Chart,

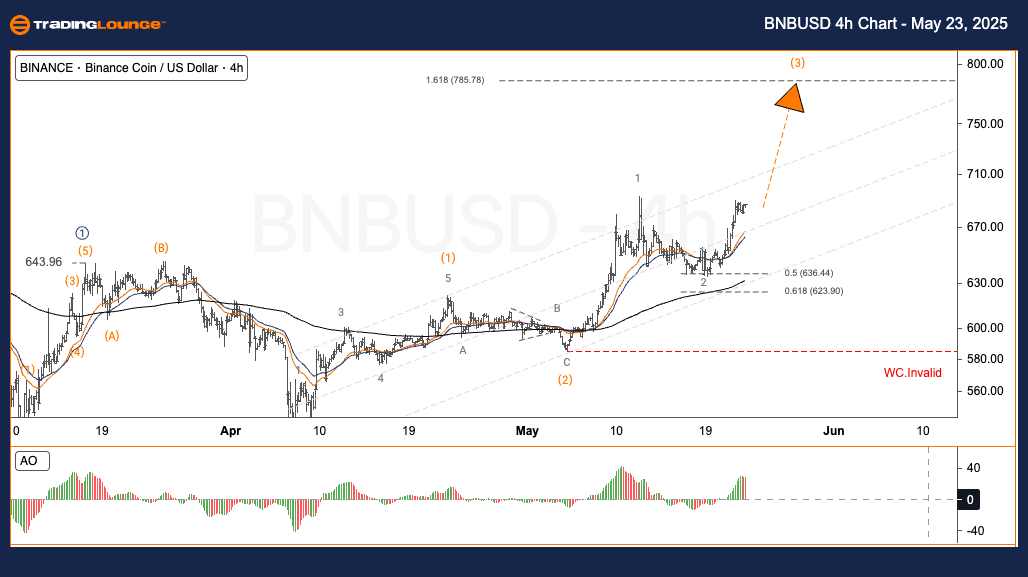
Binance / U.S. Dollar (BNBUSD) 4-Hour Chart Analysis

BNBUSD Elliott Wave Technical Analysis

Function: Trend Continuation

Mode: Motive

Structure: Impulse Wave

Current Wave Position: In progression of Wave 3

Next Major Direction: Targeting Wave IV of Impulse

Wave Invalidation Level: Unspecified

BNBUSD Trading Strategy – H4 Chart Perspective

BNBUSD completed its Wave (2) correction near the key Fibonacci retracement levels (0.5–0.618), which lies between $636 and $624. Following this, the asset surged, initiating a robust Wave (3) movement with a confirmed breakout above the upper channel resistance.

BNBUSD Trading Opportunities

✅ For Swing Traders:

  • Use the $640–$650 price zone as an optimal entry point during Wave (3) developments.
  • Profit Target Zone: Between $750 and $785, based on Fibonacci extension projections.

🟥 Risk Management:

Suggested Stop Loss Placement: Below the $620 level to safeguard against market pullbacks.

Technical Analyst: Kittiampon Somboonsod, CEWA

Source: Visit Tradinglounge.com and learn from the Experts. Join TradingLounge Here 

Previous: THETAUSD Elliott Wave Technical Analysis

VALUE Offer - Buy 1 Month & Get 3 Months!Click here

Access 7 Analysts Over 200 Markets Covered. Chat Room With Support

BNBUSD-4h-Crypto-Cha...

Related

Australian Dollar/U.S. Dollar Forex Pair: In-Depth AUDUSD Elliott Wave Technical Analysis and Trading Strategies

Australian Dollar/U.S. Dollar Forex Pair: In-Depth AUDUSD Elliott Wave Technical Analysis and Trading Strategies

This article provides an in-depth analysis of AUDUSD using the Elliott Wave theory, covering both da...

Read More >
Exxon Mobil Inc. (XOM) Stocks Elliott Wave Analysis: Stay updated with Technical analysis, and trading strategies for XOM

Exxon Mobil Inc. (XOM) Stocks Elliott Wave Analysis: Stay updated with Technical analysis, and trading strategies for XOM

Explore our in-depth Elliott Wave analysis for Exxon Mobil Inc. (XOM), featuring daily and 4-hour ch...

Read More >
Pepsico Inc.(PEP:NASDAQ) Elliott Wave Technical Analysis 23 October 23

Pepsico Inc.(PEP:NASDAQ) Elliott Wave Technical Analysis 23 October 23

Pepsico Inc.(PEP: NASDAQ) Elliott Wave Technical Analysis charts for 23 October 23

Read More >
Analysis of ASX WOW Woolworths Group Limited Uses Elliott Wave Principles to Forecast Potential Stock Movements

Analysis of ASX WOW Woolworths Group Limited Uses Elliott Wave Principles to Forecast Potential Stock Movements

Our detailed analysis of Woolworths Group Limited (ASX: WOW) uses Elliott Wave principles to forecas...

Read More >
Hang Seng Index Elliott Wave Analysis: HSI Market Outlook, Bullish Trend, Trading Strategy, Price Prediction & Technical Insights

Hang Seng Index Elliott Wave Analysis: HSI Market Outlook, Bullish Trend, Trading Strategy, Price Prediction & Technical Insights

Hang Seng Index Elliott Wave analysis provides an in-depth HSI market outlook, focusing on wave stru...

Read More >
Mastering VeChain Trading with Elliott Wave Analysis: VETUSD Technical Insights 12 February 24

Mastering VeChain Trading with Elliott Wave Analysis: VETUSD Technical Insights 12 February 24

VeChain trading with expert Elliott Wave analysis and VETUSD insights. Explore technical analysis, p...

Read More >

Buy 1 Month

Get 3 Months!

Special Offer:

Trade Recommendations

Unleash the power of deversified trading with our comprehensive portfolio, covering:

  • Stock Trades
  • Crypto Trades
  • Forex Trades
  • Commodity Trades
Elliott Wave Analysis

Gain a competive edge with expert insights in to:

  • Global Indices
  • US Stocks & ASX Stocks
  • Forex & Crypto
  • Commodities
Top-Notch Trading Tools

Equip yourself with the tools of success:

  • Social Chat
  • Elliott Wave Algorithm
  • Screener
  • TradingLevels
  • Trading Game
7 Elliott Wave Analysts

Stay ahead of the market with daily charts and insightful videos
-Your secret to strategic trading!

JOIN HERE


Welcome to TradingLounge (ASIC A.R.No. 321187), specialists in trades, trading education and technical analysis, covering stocks, indices, commodities, forex and cryptocurrencies.

When you join TradingLounge you have access to everything we offer, including trade tools, educational content and a social platform to chat with like-minded investors.

Read more

@Copyright 2024 by tradinglounge.com

Contact Us

Australian no: 02 4787 6020

International no: +61 (2) 47876020

Pay with:

Find us on