11Jul

ASX: Newmont Corporation (NEM) Elliott Wave Analysis with Bullish Targets, Invalidation Level & Technical Chart Forecast for Traders

ASX: NEWMONT CORPORATION - NEM Elliott Wave Forecast & Technical Analysis TradingLounge

Hello Traders,
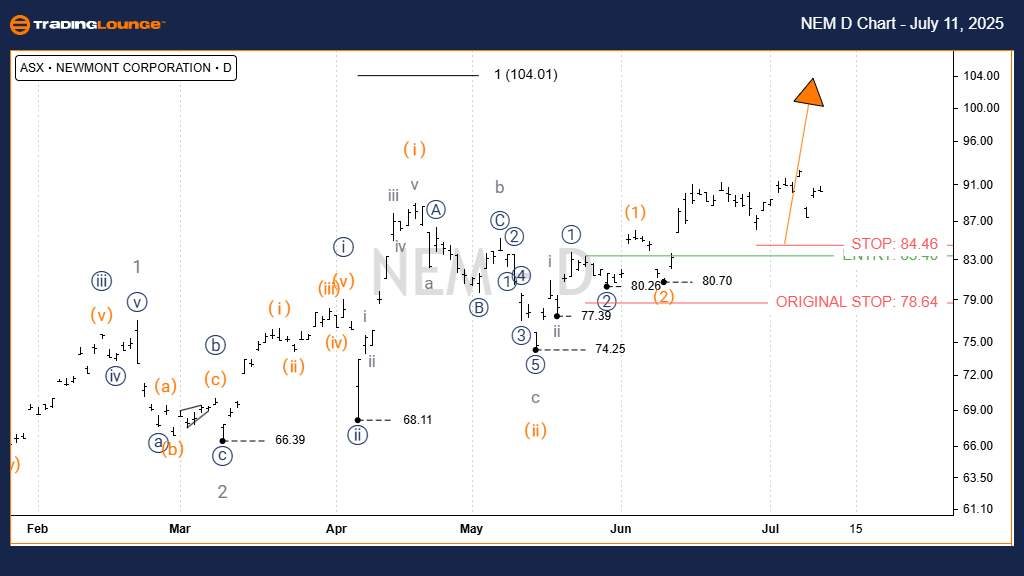
This Elliott Wave forecast for Newmont Corporation (ASX: NEM) analyzes the current trend using the daily chart. The ongoing price movement suggests a developing Wave Three advance. Below, we outline key Elliott Wave target zones and invalidation levels that traders can use to evaluate the sustainability of this bullish phase.

ASX: NEWMONT CORPORATION - NEM Elliott Wave Forecast & 1D Chart Analysis

NEWMONT CORPORATION 1D Chart (Semilog Scale) Overview

Function: Identifying the dominant trend (Minor degree, grey)

Wave Mode: Motive

Wave Structure: Impulse

Wave Position: Wave iii) - orange within Wave iii)) - navy under Wave 3 - grey

Wave Analysis:
Wave ii) - orange completed around 74.25, likely forming a zigzag correction. From that low, Wave iii) - orange has begun moving upward, currently targeting the 100.00 level.

Key Invalidation Level: 74.25

NEM-Asx-d-Chart-1107...


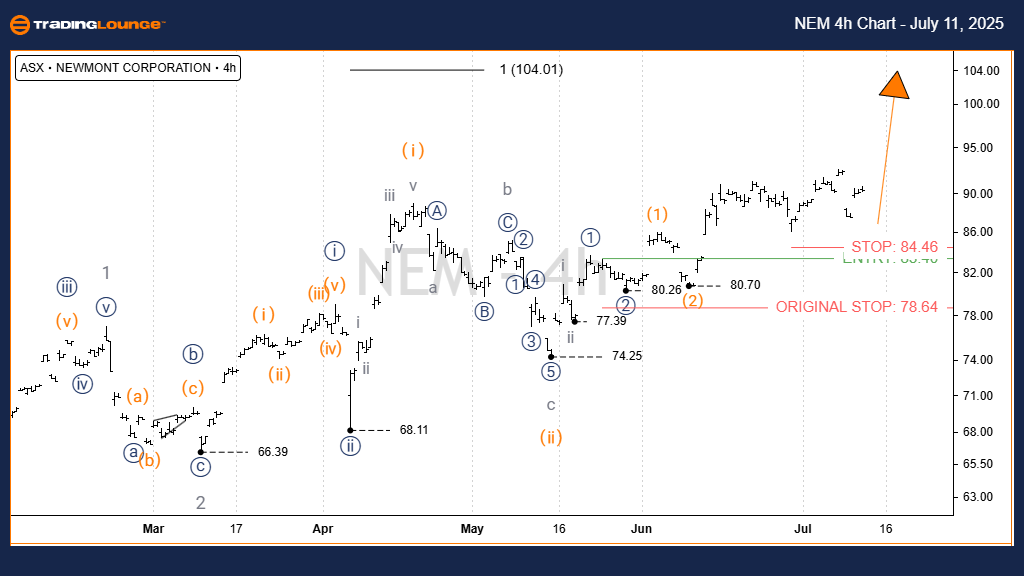
ASX: NEWMONT CORPORATION - NEM Elliott Wave Forecast TradingLounge (4-Hour Chart)

4-Hour Chart Technical Analysis Overview

Function: Tracking short- to mid-term trend (Minor degree, grey)

Wave Mode: Motive

Wave Structure: Impulse

Wave Position: Wave iii) - orange within Wave ((iii)) - navy of Wave 3 - grey

Short-Term Outlook:

The 4-hour chart confirms the daily Elliott Wave count. Wave iii) - orange is still progressing higher, with a near-term price objective at 90.00 and a mid-range goal set at 100.00.

Key Invalidation Level: 74.25

Technical Analyst: Hua (Shane) Cuong, CEWA‑M (Certified Elliott Wave Analyst – Master Level)

Source: Visit Tradinglounge.com and learn from the Experts. Join TradingLounge Here 

See Previous: AMCOR PLC – AMC Elliott Wave Technical Analysis

VALUE Offer - $1 for 2 Weeks then $29 a month!Click here

Access 7 Analysts Over 200 Markets Covered. Chat Room With Support

NEM-Asx-4h-Chart-110...


Conclusion

This technical analysis for ASX: NEM (Newmont Corporation) combines long-term Elliott Wave trends with actionable short-term insights. Clear target and invalidation levels help validate the bullish scenario and support more confident decision-making for traders seeking a structured market approach.

Related

Dow Jones Index Financial News and Market Updates: DJI Elliott Wave Technical Analysis and Best Stocks to Buy

Dow Jones Index Financial News and Market Updates: DJI Elliott Wave Technical Analysis and Best Stocks to Buy

Our comprehensive Elliott Wave Analysis of the Dow Jones Industrial Average (DJI) offers valuable in...

Read More >
Technical Analysis of GX Uranium: GX Uranium Commodity Elliott Wave Analysis

Technical Analysis of GX Uranium: GX Uranium Commodity Elliott Wave Analysis

In an ever-evolving uranium market, the GX Uranium ETF (URA) stands out as a pivotal investment oppo...

Read More >
Analog Devices Inc.(ADI:NASDAQ) Elliott Wave Technical Analysis 31 October 23

Analog Devices Inc.(ADI:NASDAQ) Elliott Wave Technical Analysis 31 October 23

Analog Devices Inc., Elliott Wave Technical AnalysisAnalog Devices Inc.,  (ADI:NASDAQ): 4H Char...

Read More >
NEOUSD Elliott Wave Analysis: Bullish Setup for Wave (3) | NEO Price Prediction and Swing Trade Strategies for Crypto Traders

NEOUSD Elliott Wave Analysis: Bullish Setup for Wave (3) | NEO Price Prediction and Swing Trade Strategies for Crypto Traders

NEOUSD is stabilising after a major decline, setting up a bullish Elliott Wave (3) rally. Learn key ...

Read More >
British Pound to US Dollar Forex Currency Pair: GBPUSD Forex Elliott Wave Technical Analysis

British Pound to US Dollar Forex Currency Pair: GBPUSD Forex Elliott Wave Technical Analysis

This article provides a thorough GBPUSD Elliott Wave Analysis, covering essential aspects such as pr...

Read More >
Hang Seng Index Elliott Wave Analysis: HSI Market Outlook, Bullish Trend, Trading Strategy, Price Prediction & Technical Insights

Hang Seng Index Elliott Wave Analysis: HSI Market Outlook, Bullish Trend, Trading Strategy, Price Prediction & Technical Insights

Hang Seng Index Elliott Wave analysis provides an in-depth HSI market outlook, focusing on wave stru...

Read More >

$1 for 2 Weeks

then $29 a month!

What a Special Offer!

Trade Recommendations

Unleash the power of deversified trading with our comprehensive portfolio, covering 250+ markets:

  • Stock Trades
  • Crypto Trades
  • Forex Trades
  • Commodity Trades
Elliott Wave Analysis

Gain a competitive edge with expert insights and AI-powered Elliott Wave charting into:

  • Global Indices
  • US Stocks & ASX Stocks
  • Forex & Crypto
  • Commodities
Top-Notch Trading Tools

Equip yourself with the tools of success:

  • Real-time Chat rooms
  • Elliott Wave Algorithm
  • Portfolio tools
  • TradingLevels
  • Screener
  • Trading Game
7 Elliott Wave Analysts

Stay ahead of the market with daily charts and insightful videos
Your secret to strategic trading!

JOIN HERE


Welcome to TradingLounge (ASIC A.R.No. 321187), specialists in trades, trading education and technical analysis, covering stocks, indices, commodities, forex and cryptocurrencies.

When you join TradingLounge you have access to everything we offer, including trade tools, educational content and a social platform to chat with like-minded investors.

Read more

@Copyright 2024 by tradinglounge.com

Contact Us

Australian no: 02 4787 6020

International no: +61 (2) 47876020

Pay with:

Find us on