01Feb

Visa Inc. (V) Elliott Wave Technical Analysis 1 February 24: Navigating Trends and Corrections for Informed Trading

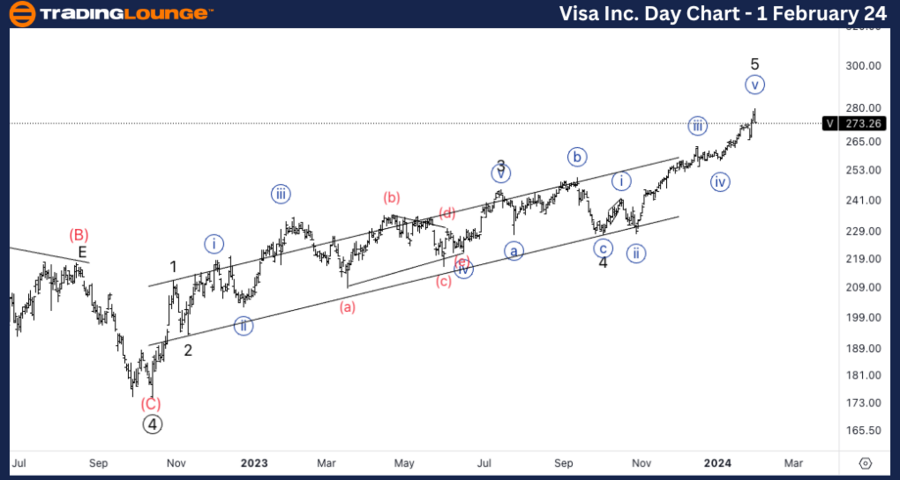
Visa (V) Elliott Wave Analysis Trading Lounge Daily Chart, 1 February 24

Visa Inc., (V) Daily Chart

Visa Elliott Wave Technical Analysis

FUNCTION: Trend

MODE: Impulse

STRUCTURE: Motive

POSITION: Minute wave {v} of 5.  

DIRECTION: Top in wave 5.  

DETAILS: Potential top in place in wave 5 as we reached 280$. There is a possibility we will continue higher, nevertheless we could expect strong resistance at 300&.

Technical Analyst: Alessio Barretta

Source: Tradinglounge.com, Learn From the Experts Join TradingLounge Here 

See Previous: Eli Lilly & Co., (LLY)
Visa-Inc-Day-Stock-c...


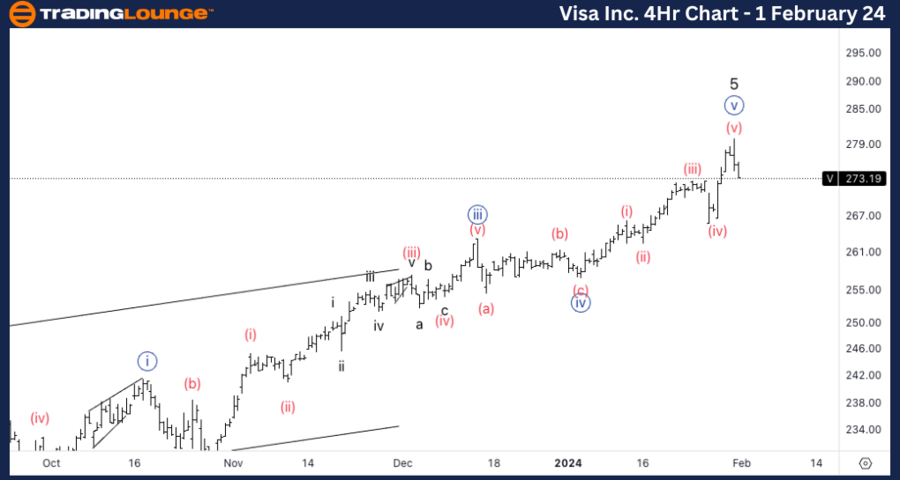
V Elliott Wave Analysis Trading Lounge 4Hr Chart, 1 February 24

Visa Inc., (V) 4Hr Chart

V Elliott Wave Technical Analysis
 
FUNCTION: Counter Trend

MODE: Corrective

STRUCTURE: Zigzag  

POSITION: Wave {i} of A.  

DIRECTION: Downside into wave {i}.

DETAILS: Looking for acceleration lower to confirm the overall bearish count. We would need to break the bottom of wave (iv) to have additional confirmation.
 
Welcome to our V Elliott Wave Analysis Trading Lounge, providing insights into Visa Inc. (V) based on Elliott Wave Technical Analysis. As of the Daily Chart on 1st February 2024, we observe a significant development in the trend.

V Elliott Wave Technical Analysis – Daily Chart

In terms of the wave function, we identify a prevailing impulse mode characterized by a motive structure. The current position is in Minute wave {v} of 5, indicating a potential top at $280. While the possibility of further upward movement exists, it's crucial to note the anticipated strong resistance around $300.

V Elliott Wave Technical Analysis – Daily Chart

Shifting our focus to the 4Hr Chart on the same date, we analyze Visa Inc. (V) through the lens of Elliott Wave Technical Analysis.

Here, the wave function takes a counter trend stance with a corrective mode, manifesting a zigzag structure. The present position is in Wave {i} of A, suggesting a downside trajectory into wave {i}. To validate the overall bearish outlook, we are actively monitoring for an acceleration lower, awaiting confirmation through a break below the bottom of wave (iv).

Stay tuned for updates as we navigate the dynamic landscape of Visa Inc. (V) using Elliott Wave Analysis. Our expert analysis aims to provide you with valuable insights for informed trading decisions in this ever-evolving market.
Visa-Inc-4H-Stock-ch...

Related

Elliott Wave Trading Strategies: SP500, NASDAQ 100, and Top Tech Stocks Analysis

Elliott Wave Trading Strategies: SP500, NASDAQ 100, and Top Tech Stocks Analysis

This analysis explores Elliott Wave technical insights for major indices and leading tech stocks. Th...

Read More >
Offering Traders Valuable Guidance on AVY's Market Trajectory: Avery Dennison Corp. Stocks Elliott Wave Technical Analysis

Offering Traders Valuable Guidance on AVY's Market Trajectory: Avery Dennison Corp. Stocks Elliott Wave Technical Analysis

This article provides a comprehensive Elliott Wave analysis of Avery Dennison Corp. (AVY). It covers...

Read More >
Elliott Wave Technical Analysis for Visa Inc.(V) Stocks Predictions, Stock Trends, and Technical Insights

Elliott Wave Technical Analysis for Visa Inc.(V) Stocks Predictions, Stock Trends, and Technical Insights

This article provides an in-depth Elliott Wave analysis of Visa Inc., examining the technical aspect...

Read More >
U.S. Dollar/Swiss Franc (USDCHF) Forex Elliott Wave Technical Analysis for both day and 4-hour charts

U.S. Dollar/Swiss Franc (USDCHF) Forex Elliott Wave Technical Analysis for both day and 4-hour charts

This article provides an in-depth USDCHF Elliott Wave analysis for both day and 4-hour charts. It co...

Read More >
Our Expert U.S. Dollar/Canadian Dollar Technical Analysis and Forecasts with USDCAD Forex Elliott Wave Technical Analysis

Our Expert U.S. Dollar/Canadian Dollar Technical Analysis and Forecasts with USDCAD Forex Elliott Wave Technical Analysis

Our detailed USDCAD Elliott Wave analysis provides insights into the current market trends, focusing...

Read More >
Euro/U.S.Dollar(EURUSD) Day Chart Elliott Wave Technical Analysis 10 November 23

Euro/U.S.Dollar(EURUSD) Day Chart Elliott Wave Technical Analysis 10 November 23

Euro/U.S.Dollar(EURUSD) Day Chart Elliott Wave Technical Analysis 10 November 23 suggests a Counter ...

Read More >

Buy 1 Month

Get 3 Months!

Special Offer:

Trade Recommendations

Unleash the power of deversified trading with our comprehensive portfolio, covering:

  • Stock Trades
  • Crypto Trades
  • Forex Trades
  • Commodity Trades
Elliott Wave Analysis

Gain a competive edge with expert insights in to:

  • Global Indices
  • US Stocks & ASX Stocks
  • Forex & Crypto
  • Commodities
Top-Notch Trading Tools

Equip yourself with the tools of success:

  • Social Chat
  • Elliott Wave Algorithm
  • Screener
  • TradingLevels
  • Trading Game
7 Elliott Wave Analysts

Stay ahead of the market with daily charts and insightful videos
-Your secret to strategic trading!

JOIN HERE


Welcome to TradingLounge (ASIC A.R.No. 321187), specialists in trades, trading education and technical analysis, covering stocks, indices, commodities, forex and cryptocurrencies.

When you join TradingLounge you have access to everything we offer, including trade tools, educational content and a social platform to chat with like-minded investors.

Read more

@Copyright 2024 by tradinglounge.com

Contact Us

Australian no: 02 4787 6020

International no: +61 (2) 47876020

Pay with:

Find us on