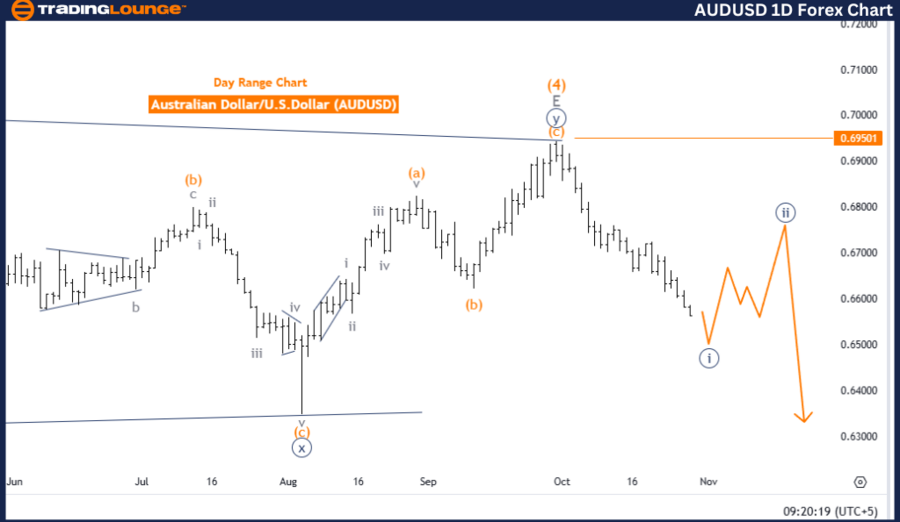
Australian Dollar/U.S. Dollar (AUDUSD) Day Chart
AUDUSD Elliott Wave Technical Analysis
Trend: Bearish
Mode: Impulsive
Wave Structure: Navy Blue Wave 1
Position: Gray Wave 1
Next Higher Degree Direction: Navy Blue Wave 2
Wave Details: Navy blue wave 1 within gray wave 1 remains active and nears completion.
Wave Invalidation Level: 0.69501
The daily AUDUSD Elliott Wave analysis confirms a bearish trend with an impulsive structure in navy blue wave 1, embedded within the broader gray wave 1 framework. This pattern points toward an initial stage of a larger downward trajectory, with navy blue wave 1 advancing but nearing completion. The impulsive nature of this pattern reinforces a continued bearish sentiment, suggesting ongoing downward momentum within the broader wave configuration.
In this analysis, navy blue wave 1 forms the start of a larger bearish cycle within gray wave 1. Once navy blue wave 1 finalizes, it could trigger the beginning of navy blue wave 2, likely initiating a corrective phase. This anticipated wave 2 may introduce a temporary upward retracement, countering the dominant bearish movement.
The critical level for this wave structure is set at 0.69501, serving as the invalidation threshold. A breach above this point would invalidate the current wave count, hinting at a potential shift in trend. However, as long as the price stays below this level, the bearish count holds, supporting the ongoing downward trajectory.
Summary:
The AUDUSD daily chart analysis confirms a bearish trend in navy blue wave 1 of gray wave 1. With navy blue wave 1 nearing completion, a transition to navy blue wave 2 may introduce a corrective phase. The 0.69501 level is key for validating this bearish structure and overall outlook.
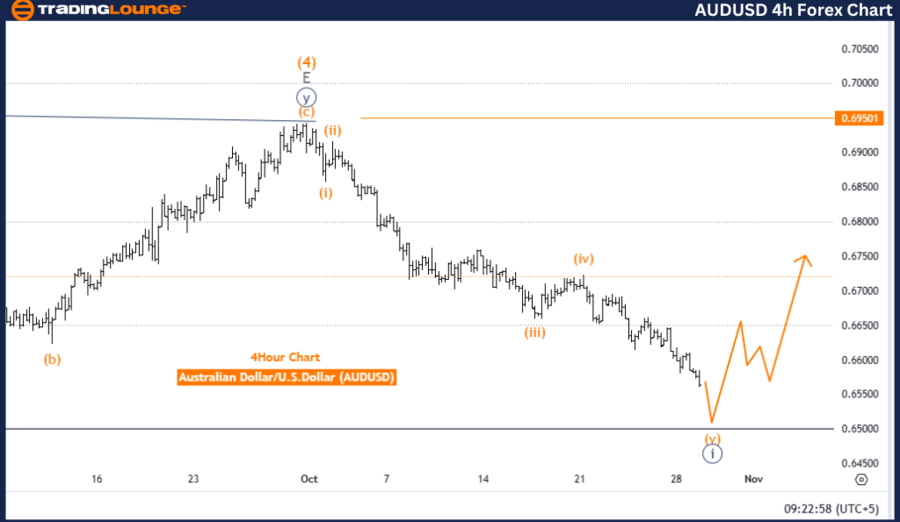
Australian Dollar/U.S. Dollar (AUDUSD) 4-Hour Chart
AUDUSD Elliott Wave Technical Analysis
Trend: Bearish
Mode: Impulsive
Wave Structure: Orange Wave 5
Position: Navy Blue Wave 1
Next Higher Degree Direction: Navy Blue Wave 2
Wave Details: Orange wave 4 in navy blue wave 1 appears complete; orange wave 5 in navy blue wave 1 is active and nearing completion.
Wave Invalidation Level: 0.69501
The 4-hour AUDUSD Elliott Wave analysis highlights a bearish trend within an impulsive structure, with a focus on orange wave 5 as part of the larger navy blue wave 1. This pattern indicates sustained downward pressure aligned with the current bearish momentum. With orange wave 4 finalized, orange wave 5 within navy blue wave 1 continues to progress. In Elliott Wave theory, the fifth wave typically marks the last phase of the current trend, suggesting that navy blue wave 1 is approaching its end.
The descent of orange wave 5 signals the imminent conclusion of navy blue wave 1. As orange wave 5 advances, it reinforces the bearish perspective, affirming that the trend remains downward. Once navy blue wave 1 completes, a corrective phase in navy blue wave 2 might begin, potentially causing a short-term reversal.
The wave invalidation level for this structure is set at 0.69501, a critical point for preserving the current wave count. If the price surpasses this level, it would invalidate the present wave formation, potentially shifting the anticipated trend direction. However, as long as the price remains below this point, the bearish, impulsive pattern holds.
Summary:
The AUDUSD 4-hour chart depicts a bearish, impulsive structure in orange wave 5, marking the final stage of navy blue wave 1. The downward trend is expected to persist until navy blue wave 1 concludes, after which a potential corrective wave 2 may follow. The 0.69501 level remains a pivotal validation point in this analysis.
Technical Analyst: Malik Awais
Source: visit Tradinglounge.com and learn From the Experts Join TradingLounge Here
Previous: GBPUSD Elliott Wave Technical Analysis
VALUE Offer - Buy 1 Month & Get 3 Months!Click here
Access 7 Analysts Over 200 Markets Covered. Chat Room With Support