02Jul

MINERAL RESOURCES LIMITED - MIN Elliott Wave Analysis Reveals Upside Targets After Wave 4 Ends Around $14.05 Low

ASX: MIN Elliott Wave Forecast – Bullish Wave 5 Setup Emerging

ASX-listed MINERAL RESOURCES LIMITED (ASX: MIN) is under our latest Elliott Wave radar. Technical patterns suggest that the major Wave 4 correction has concluded, positioning the stock for a potential Wave 5 advance. This report identifies target levels and critical invalidation markers.


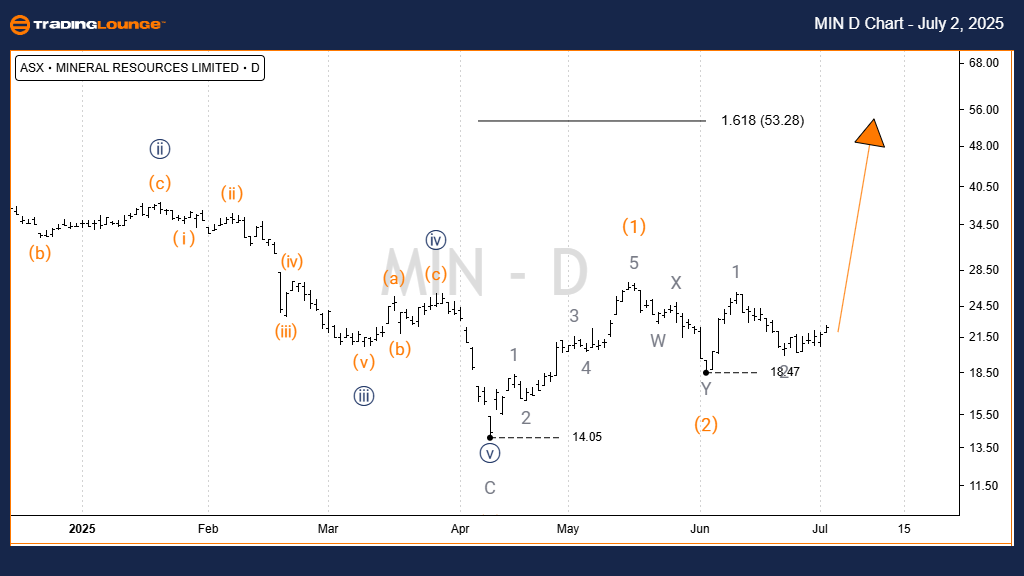
MINERAL RESOURCES LIMITED - MIN 1D Chart (Semilog Scale) Analysis

Function: Major Trend (Intermediate Degree, Orange)

Mode: Motive

Structure: Impulse

Position: Wave 3 (Orange) of Wave 5 (Navy)

The correction found a solid base at $14.05, indicating that a fresh impulse wave is likely underway. The bullish trajectory projects a target zone between $50.00 and $80.00. To maintain this outlook, the price must stay above the $14.05 level. A drop below $18.47 does not break the bullish structure but implies a deeper Wave 2 retracement, after which Wave 3 (Orange) may unfold upwards.

Invalidation Point: $14.05

MIN-D-ASX-CHART-0207...


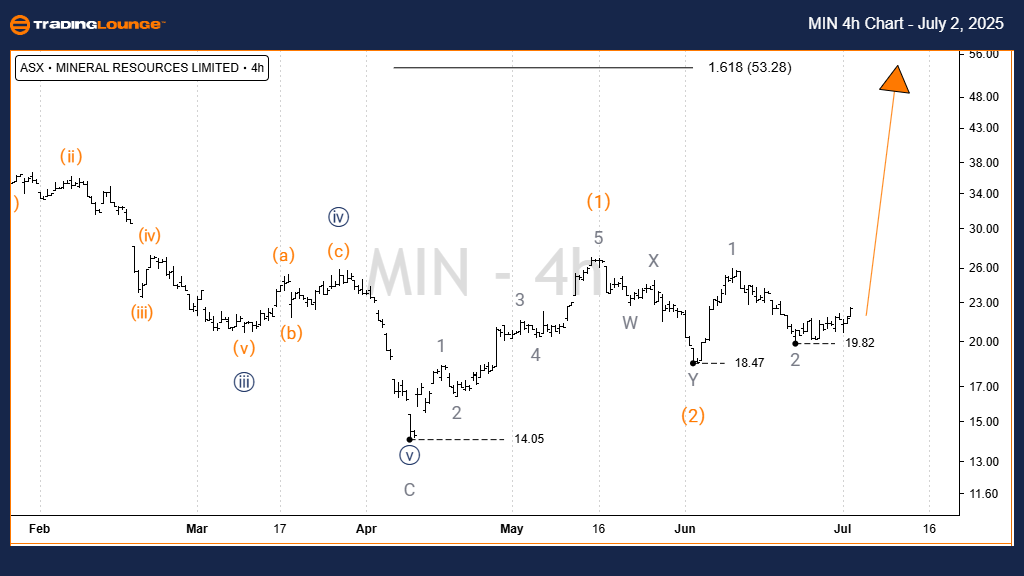
MINERAL RESOURCES LIMITED - MIN 4-Hour Chart Analysis

Function: Major Trend (Intermediate Degree, Orange)

Mode: Motive

Structure: Impulse

Position: Wave 3 (Orange)

The 4-hour timeframe confirms that Wave 1 (Orange) ended with a clear five-wave move down to $14.05. A Double Zigzag correction completed Wave 2 (Orange) at $18.47, preparing for a potential rise toward $53.28 as Wave 3 begins. While any dip below $18.47 signals a lengthier correction phase, it does not invalidate the broader bullish pattern.

Invalidation Point: $14.05

Technical Analyst: Hua (Shane) Cuong, Certified Elliott Wave Analyst – Master Level (CEWA-M).

Source: Visit Tradinglounge.com and learn from the Experts. Join TradingLounge Here 

See Previous: NORTHERN STAR RESOURCES LTD – NST Elliott Wave Technical Analysis

VALUE Offer - Buy 1 Month & Get 3 Months!Click here

Access 7 Analysts Over 200 Markets Covered. Chat Room With Support

MIN-4H-ASX-CHART-020...


Conclusion

This updated Elliott Wave forecast for MINERAL RESOURCES LIMITED (ASX: MIN) highlights bullish technical potential, key trend levels, and price zones to monitor. Our analysis supports traders with clear, theory-based targets and critical support levels, helping to validate or adjust trading strategies based on evolving price action.

Related

British Pound/Japanese Yen(GBPJPY) Elliottwave Technical analysis - A Comprehensive Overview for Day and 4-Hour Charts

British Pound/Japanese Yen(GBPJPY) Elliottwave Technical analysis - A Comprehensive Overview for Day and 4-Hour Charts

This comprehensive guide offers an in-depth Elliott Wave analysis of the GBPJPY currency pair, provi...

Read More >
Detailed Elliott Wave Analysis of ASX Sonic Healthcare Limited (SHL) with Stock Forecasts, Price Targets, and Market Predictions

Detailed Elliott Wave Analysis of ASX Sonic Healthcare Limited (SHL) with Stock Forecasts, Price Targets, and Market Predictions

This detailed Elliott Wave analysis of ASX Sonic Healthcare Limited (SHL) provides insights into the...

Read More >
INFOSYS Elliott Wave Forecast: Wave 4 Correction Nears Completion Before Potential Wave 5 Decline – Key Trade Setup Levels

INFOSYS Elliott Wave Forecast: Wave 4 Correction Nears Completion Before Potential Wave 5 Decline – Key Trade Setup Levels

INFOSYS stock is in a corrective wave pattern. This Elliott Wave analysis highlights potential resis...

Read More >
TASI Index Elliott Wave Analysis – Saudi Stock Market Chart Insights To Help Traders Manage Risk and Optimize their Trading Strategies

TASI Index Elliott Wave Analysis – Saudi Stock Market Chart Insights To Help Traders Manage Risk and Optimize their Trading Strategies

This comprehensive analysis of the TASI Index provides insights into Elliott Wave structures on both...

Read More >
Nikkei 225 (N225) Elliott Wave Forecast Shows Bullish Wave 3 Structure with Strong Uptrend Signals Across Daily and Weekly Charts

Nikkei 225 (N225) Elliott Wave Forecast Shows Bullish Wave 3 Structure with Strong Uptrend Signals Across Daily and Weekly Charts

Nikkei 225 reveals a strong bullish trend with impulsive wave formations on both daily and weekly ch...

Read More >
FTSE 100 (UK) Elliott Wave Analysis: Bullish Trend, Wave Counts, Market Forecast, and Trading Strategies for Informed Decisions

FTSE 100 (UK) Elliott Wave Analysis: Bullish Trend, Wave Counts, Market Forecast, and Trading Strategies for Informed Decisions

Our FTSE 100 Elliott Wave analysis provides valuable insights into the market's bullish trend an...

Read More >

$1 for 2 Weeks

then $29 a month!

What a Special Offer!

Trade Recommendations

Unleash the power of deversified trading with our comprehensive portfolio, covering 250+ markets:

  • Stock Trades
  • Crypto Trades
  • Forex Trades
  • Commodity Trades
Elliott Wave Analysis

Gain a competitive edge with expert insights and AI-powered Elliott Wave charting into:

  • Global Indices
  • US Stocks & ASX Stocks
  • Forex & Crypto
  • Commodities
Top-Notch Trading Tools

Equip yourself with the tools of success:

  • Real-time Chat rooms
  • Elliott Wave Algorithm
  • Portfolio tools
  • TradingLevels
  • Screener
  • Trading Game
7 Elliott Wave Analysts

Stay ahead of the market with daily charts and insightful videos
Your secret to strategic trading!

JOIN HERE


Welcome to TradingLounge (ASIC A.R.No. 321187), specialists in trades, trading education and technical analysis, covering stocks, indices, commodities, forex and cryptocurrencies.

When you join TradingLounge you have access to everything we offer, including trade tools, educational content and a social platform to chat with like-minded investors.

Read more

@Copyright 2024 by tradinglounge.com

Contact Us

Australian no: 02 4787 6020

International no: +61 (2) 47876020

Pay with:

Find us on