Coffee Elliott Wave Analysis: Unveiling the Market's Future Movements
Coffee Elliott Wave Technical Analysis
Function: Counter-trend
Mode: Corrective
Structure: Triangle Wave X
Position: Wave X Still Active
Direction: Sideways Movement for X of (X)
Insightful Update on Coffee Prices: As we navigate through the complex patterns of the Elliott Wave Analysis, it's evident that the coffee market is in the midst of a crucial phase. The ongoing formation of triangle wave X is a significant development, suggesting an imminent move towards the critical resistance zone between 189.95 and 192.80. This movement marks a pivotal moment for traders, as it signals a potential shift towards a bearish phase for wave Y of (X).
Recent Market Dynamics: The coffee market witnessed a notable decline of over 14% from December 19th to January 18th. Since this period, the market has shown signs of stagnation, with prices oscillating between 197.5 and 175.5. This prolonged period of fluctuation hints at an upcoming decision point for the market, with the potential for either a breakout above $197.5 or a descent below $175.5. The downward trend seems more likely from an Elliott wave analysis perspective, as the market appears to be deepening its pullback from the December high.
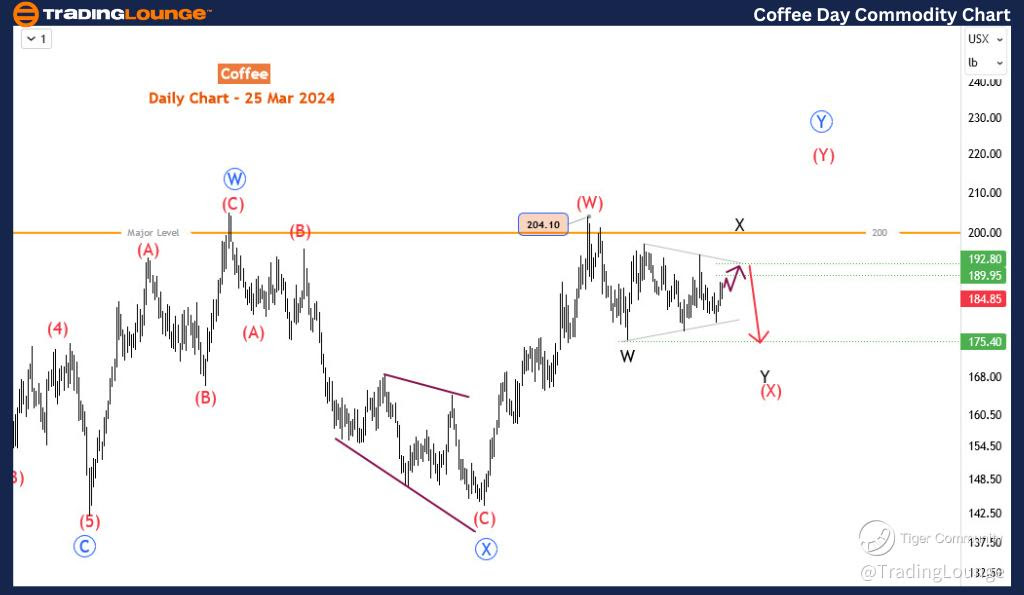
Detailed Analysis of the Elliott Wave Pattern: A closer examination of the daily chart reveals the formation of a bullish double-three pattern starting in January 2023. The first leg of this pattern, labelled blue wave ‘W’, culminated in April, followed by a downturn to October’s low, marking the beginning of blue wave ‘X’. The subsequent rally, projected to reach the 100% extension level near $208, encountered resistance at $204, highlighting a significant barrier at the $200 level.
Current Market Stance: The stagnation observed following the retreat from $204 suggests that wave Y may still be unfolding. The rally to this point likely represents wave (W) of blue ‘Y’, with the expected formation of a double-three pattern for wave X. Presently, the completion of a triangle pattern for wave X of (X) is underway, potentially leading to a downturn below $175.4. However, should a breakout occur above $197.5, it could indicate the end of wave (X) and the continuation of wave (Y) above $200. Yet, the likelihood of a downward movement remains the focal point of our analysis.
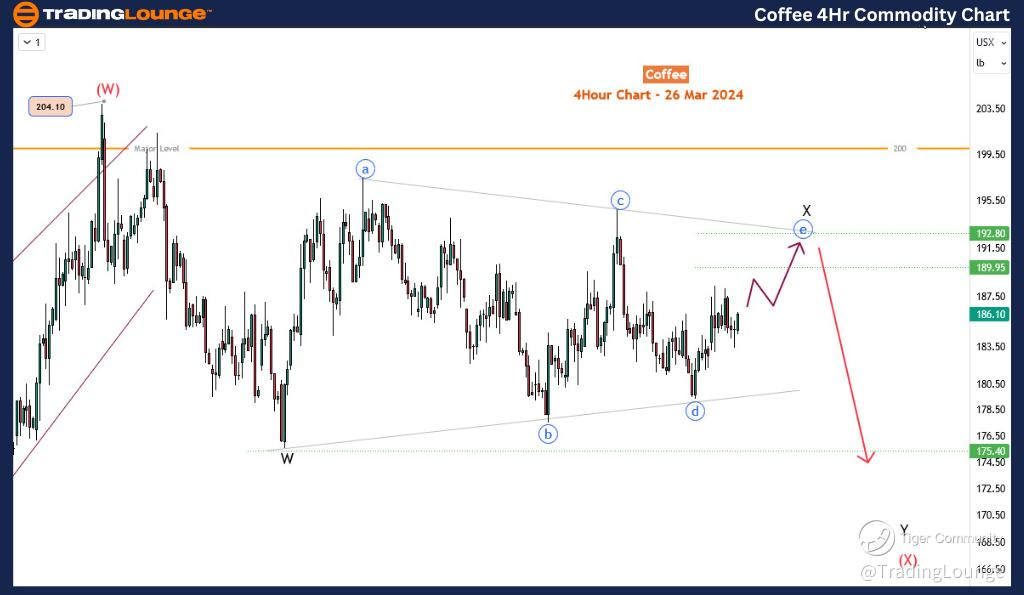
Coffee Elliott Wave Analysis Trading Lounge 4-Hour Chart
Coffee 4-Hour Chart Analysis:
4-Hour Chart Perspective: In this timeframe, the final leg of the triangle, blue wave ‘e’, is ascending and is anticipated to face resistance within the 189.95-192.8 zone. The commencement of wave Y from this juncture, contingent upon the peak of blue wave ‘c’ remaining intact, may present selling opportunities in the medium term, potentially driving prices below $175.5.
Concluding Thoughts: While alternative scenarios exist, the current analysis presents the most plausible paths for the coffee market. Traders need to maintain flexibility in their strategies, adapting to the market's evolving dynamics. The scenarios outlined offer valuable insights, and guide decisions in the ever-changing landscape of commodity trading.
Technical Analyst: Sanmi Adeagbo
Source: visit Tradinglounge.com and learn From the Experts Join TradingLounge Here
See Previous: GX Uranium ETF (URA)
TradingLounge Once Off SPECIAL DEAL: Here > 1 month Get 3 months.