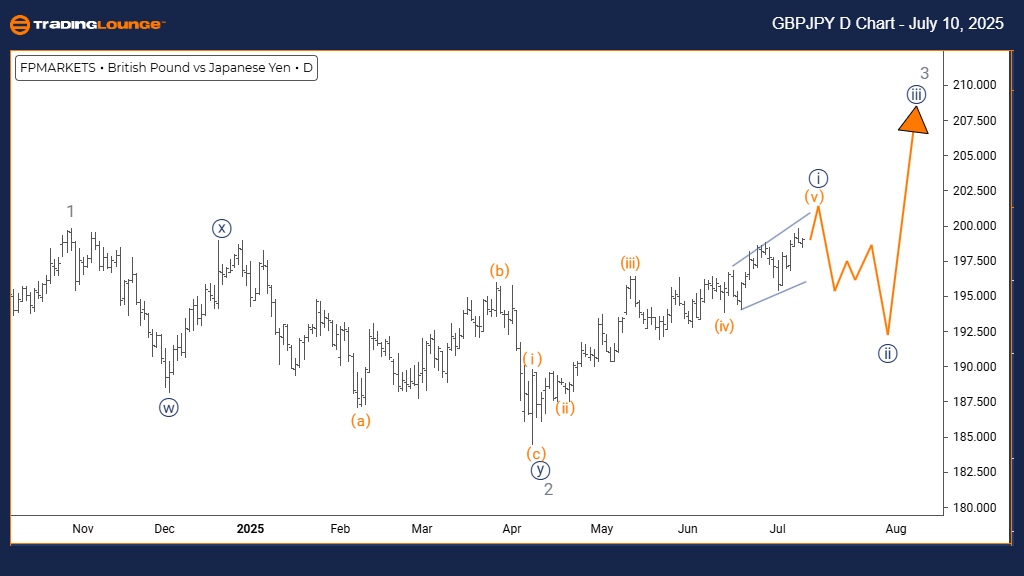
GBPJPY Elliott Wave Forecast – Trading Lounge Daily Chart
British Pound / Japanese Yen (GBPJPY) Daily Chart Analysis
GBPJPY Elliott Wave Technical Forecast
FUNCTION: Uptrend
MODE: Impulsive Pattern
STRUCTURE: Navy Blue Wave 1 in Formation
POSITION: Progressing through Gray Wave 3
DIRECTION NEXT LOWER DEGREES: Expected Navy Blue Wave 2
DETAILS: Navy Blue Wave 1 remains active and is nearing its final phase.
Daily Chart Analysis
The Elliott Wave outlook on the GBPJPY daily chart shows a continuing bullish structure. Currently, the market is in Navy Blue Wave 1, part of a broader Gray Wave 3 cycle, indicating strong upside momentum. This suggests that after this leg concludes, a pullback via Navy Blue Wave 2 is likely.
Indicators show that Navy Blue Wave 1 is approaching its peak, driven by the persistent strength typical of Gray Wave 3. Since Wave 3 often produces extended moves in Elliott Wave theory, traders should prepare for a near-term top and watch for the start of a correction, which may offer strategic entry points in line with the ongoing uptrend.
This daily timeframe analysis confirms the continuation of a bullish phase and aligns with broader market sentiment. The chart structure suggests more opportunities could emerge following the expected corrective phase, reinforcing a forward-looking trading strategy.
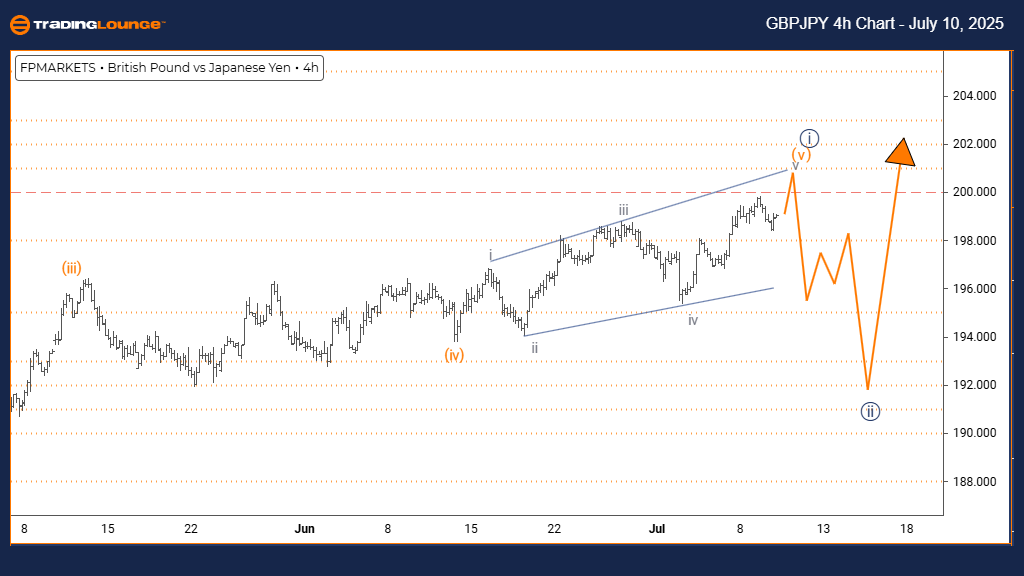
British Pound / Japanese Yen (GBPJPY) 4-Hour Chart Analysis
GBPJPY Elliott Wave Technical Forecast
FUNCTION: Continued Uptrend
MODE: Impulsive Progression
STRUCTURE: Advancing in Orange Wave 5
POSITION: Within Navy Blue Wave 1
DIRECTION NEXT LOWER DEGREES: Anticipated Navy Blue Wave 2
DETAILS: Orange Wave 4 appears complete; development of Orange Wave 5 is underway.
4-Hour Chart Overview
The GBPJPY 4-hour Elliott Wave structure continues to support a bullish bias, now unfolding in Orange Wave 5 within the broader Navy Blue Wave 1. This wave typically marks the concluding leg of an impulsive sequence before a correction—here projected as Navy Blue Wave 2.
With Orange Wave 4 now behind, Orange Wave 5 gains traction, reflecting sustained upward pressure. Still, traders should monitor for signs of waning momentum or reversal as this wave matures, since final waves often exhibit fading strength.
For short- to medium-term traders, the 4-hour chart offers insights into imminent price shifts. Recognizing divergence or reduced momentum can help fine-tune entry and exit strategies. As this impulsive move nears completion, it creates a watchlist setup for a possible trend change or continuation after a pullback.
Technical Analyst: Malik Awais
Source: Visit Tradinglounge.com and learn from the Experts. Join TradingLounge Here
Previous: NZDUSD Elliott Wave Technical Analysis
VALUE Offer - $1 for 2 Weeks then $29 a month!Click here
Access 7 Analysts Over 200 Markets Covered. Chat Room With Support