15Jul

Walmart Inc. U.S. Stocks: WMT Elliott Wave Technical Forecast Reveals Support Level with Bullish Wave {v} Breakout Potential on Charts

Walmart Inc. (WMT) – Daily and 1H Charts Overview

Walmart Inc. (WMT) Elliott Wave Analysis - Tradinglounge Daily Chart

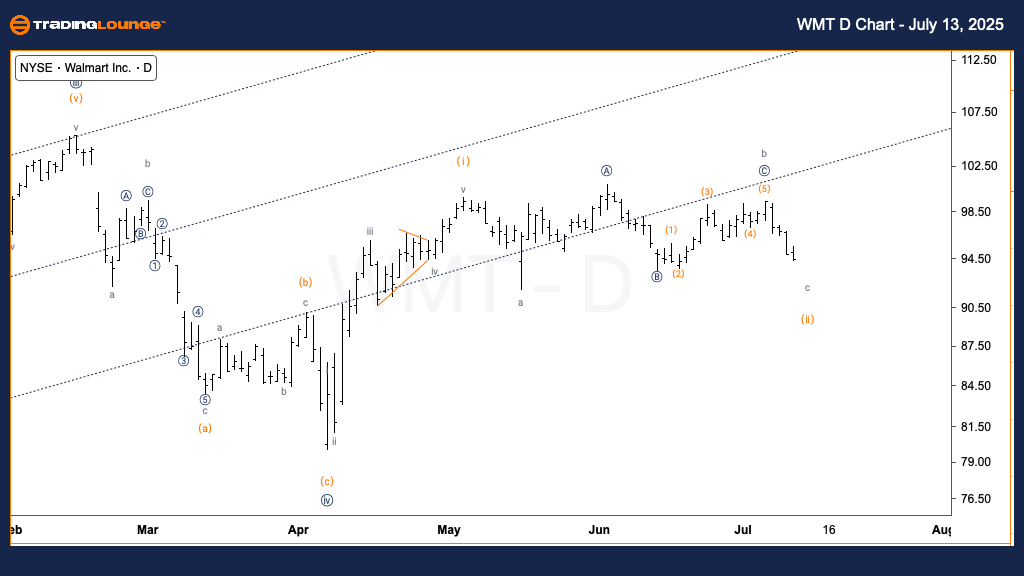
Walmart Inc. (WMT) Daily Chart Overview

WMT Elliott Wave Technical Analysis

Function: Trend

Mode: Impulsive

Structure: Motive

Position: Wave {v}

Direction: Upside in wave {v}

Details: The current Elliott Wave count for Walmart Inc. (WMT) suggests that wave {iv} has likely bottomed. However, due to the extended corrective structure, there's an alternate possibility that wave (ii) is still evolving as part of wave {iv}, forming a flat correction.

Walmart (WMT) appears to be entering wave {v} on the daily chart, potentially signaling the start of a new upward move. While the primary scenario supports a bullish breakout, ongoing corrective action opens the door for wave {iv} to remain in progress within a flat correction of wave (ii).

The market's structure remains favorable for a bullish continuation, but confirmation is essential before validating the start of wave {v}.

WMT-us-stock-D-Chart...


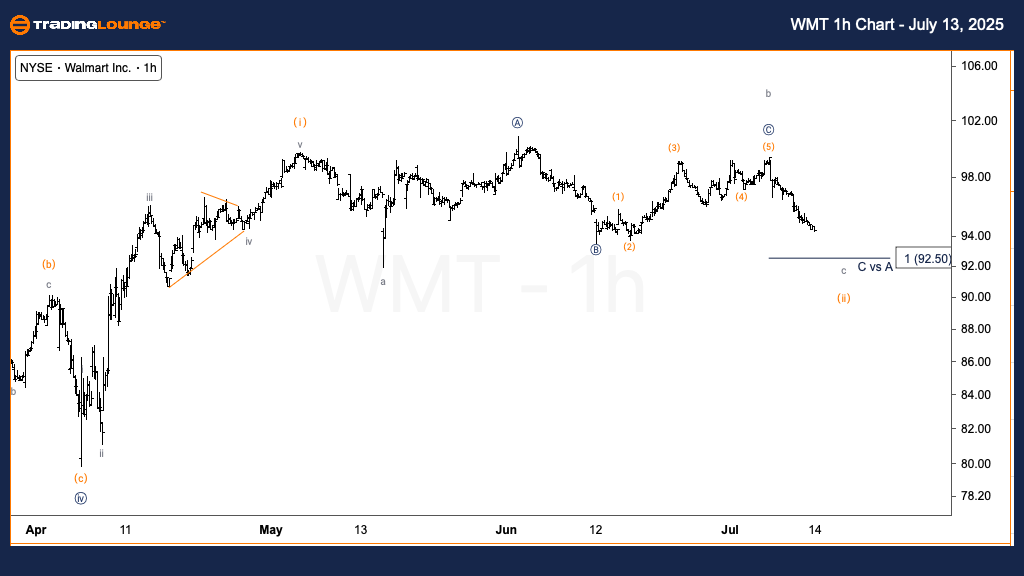
Walmart Inc. (WMT) Elliott Wave Analysis - Tradinglounge 1H Chart

Walmart Inc. (WMT) 1H Chart Overview

Function: Counter Trend

Mode: Corrective

Structure: Flat

Position: Wave c of (ii)

Direction: Bottoming in wave c

Details: Walmart's intraday price action on the 1-hour chart reflects a corrective flat structure in wave (ii), with wave c approaching completion. The anticipated support lies near $92, which aligns with wave c achieving parity with wave a.

The $92 level serves as a critical support zone, and a reversal from this area could confirm the conclusion of wave (ii). This would likely initiate the next bullish phase, wave {v}. Until that reversal materializes, it is advisable for traders to remain cautious and look for confirmation before considering new long positions.

Technical Analyst: Alessio Barretta

Visit: TradingLounge.com for detailed analysis and market updates.

Previous: Avery Dennison Corp. (AVY) Elliott Wave Technical Analysis

VALUE Offer - $1 for 2 Weeks then $29 a month!Click here

Access 7 Analysts Over 200 Markets Covered. Chat Room With Support

WMT-us-stock-1h-Char...

Related

Bitcoin/U.S. dollar(BTCUSD) Elliott Wave Technical Analysis 17 October 23

Bitcoin/U.S. dollar(BTCUSD) Elliott Wave Technical Analysis 17 October 23

Trading lounge Bitcoin/U.S. dollar(BTCUSD) Elliott Wave Technical Analysis 4-hour and day charts for...

Read More >
Euro/British Pound(EURGBP) Elliott Wave Technical Analysis 13 December 23

Euro/British Pound(EURGBP) Elliott Wave Technical Analysis 13 December 23

EURGBP Elliott Wave Analysis Trading Lounge Day Chart for 13 December 23, provides a comprehensive a...

Read More >
ASX: Mineral Resources Limited (MIN) Elliott Wave Analysis Highlights Bullish Trend With $50-$80 Price Target and Key Support Levels

ASX: Mineral Resources Limited (MIN) Elliott Wave Analysis Highlights Bullish Trend With $50-$80 Price Target and Key Support Levels

Elliott Wave analysis of ASX: Mineral Resources Limited (MIN) highlights a bullish trend with well-d...

Read More >
Natural Gas Elliott Wave Technical Analysis: Key Resistance Zone Ahead

Natural Gas Elliott Wave Technical Analysis: Key Resistance Zone Ahead

Natural gas prices are nearing a critical resistance zone after experiencing an upward correction wi...

Read More >
Swiss Market Index Elliott Wave Technical Analysis: Covers All Essential Aspects of SMI Trading  and Looking for Bullish Trends

Swiss Market Index Elliott Wave Technical Analysis: Covers All Essential Aspects of SMI Trading and Looking for Bullish Trends

This article thoroughly analyses the Swiss Market Index (SMI) using Elliott Wave theory, offering va...

Read More >
Gold (XAUUSD) Commodity Ongoing Bullish Trend in the Market: In-Depth Elliott Wave Technical Analysis and Forecast

Gold (XAUUSD) Commodity Ongoing Bullish Trend in the Market: In-Depth Elliott Wave Technical Analysis and Forecast

In this detailed Gold Elliott Wave analysis, we explore the ongoing bullish trend in the gold market...

Read More >

$1 for 2 Weeks

then $29 a month!

What a Special Offer!

Trade Recommendations

Unleash the power of deversified trading with our comprehensive portfolio, covering 250+ markets:

  • Stock Trades
  • Crypto Trades
  • Forex Trades
  • Commodity Trades
Elliott Wave Analysis

Gain a competitive edge with expert insights and AI-powered Elliott Wave charting into:

  • Global Indices
  • US Stocks & ASX Stocks
  • Forex & Crypto
  • Commodities
Top-Notch Trading Tools

Equip yourself with the tools of success:

  • Real-time Chat rooms
  • Elliott Wave Algorithm
  • Portfolio tools
  • TradingLevels
  • Screener
  • Trading Game
7 Elliott Wave Analysts

Stay ahead of the market with daily charts and insightful videos
Your secret to strategic trading!

JOIN HERE


Welcome to TradingLounge (ASIC A.R.No. 321187), specialists in trades, trading education and technical analysis, covering stocks, indices, commodities, forex and cryptocurrencies.

When you join TradingLounge you have access to everything we offer, including trade tools, educational content and a social platform to chat with like-minded investors.

Read more

@Copyright 2024 by tradinglounge.com

Contact Us

Australian no: 02 4787 6020

International no: +61 (2) 47876020

Pay with:

Find us on