Gold Elliott Wave Analysis
Gold Elliott Wave Analysis: Strong Rally with More Upside Expected
Gold has recently broken out of its 3-week consolidation range, reaching a new all-time high. This continued rally has been highly rewarding for investors in 2024. After concluding a 51-month bearish phase that began in September 2011 and ended in September 2022, gold has surged nearly 60%. Although this upward momentum shows no immediate signs of slowing, traders should exercise caution before entering new positions at elevated levels. Below is a comprehensive Elliott Wave analysis.
Long-Term Chart Analysis
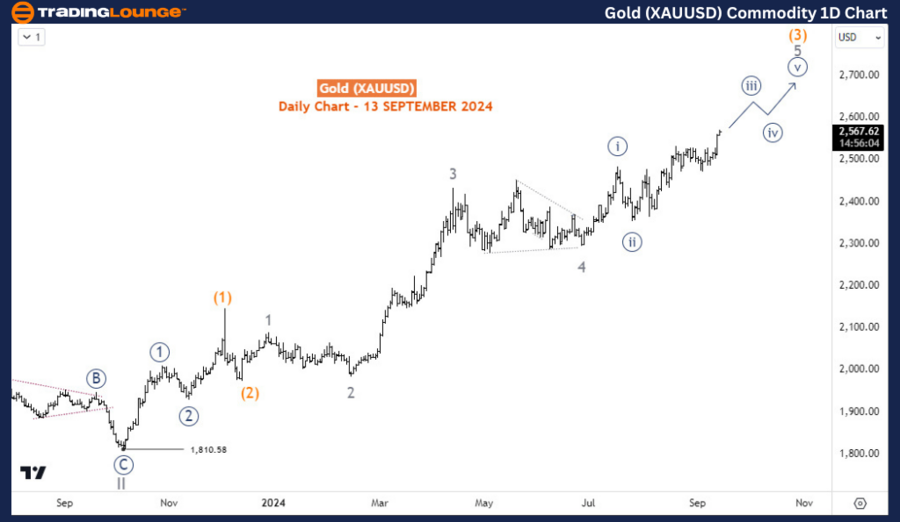
On the daily chart, gold has maintained a steady upward trend since December 2015. According to Elliott Wave theory, the market completed the supercycle degree wave (IV) in September 2022, marking the end of a prolonged bearish phase that started in September 2011. The conclusion of wave (IV) laid the groundwork for the impulsive wave (V), which is currently unfolding.
Within wave (V), waves I and II completed in May and October 2023, respectively. Gold is now advancing in wave (3) of 3 (circled) of wave III. Wave (3), a strong impulse wave, is driving prices higher and is currently in its final phase, identified as wave 5 of (3). This final leg of wave (3) is forming an impulsive structure, signaling continued bullish momentum.
The current strength of the uptrend suggests that traders could benefit from buying on pullbacks, which may provide attractive entry points for long positions. Long-term investors are also encouraged to hold their positions, as the broader trend remains bullish, with potential for further upside.
Gold (XAUUSD) Commodity Daily Chart Analysis
A closer examination of the daily chart reveals that the ongoing advance in wave (3) is part of a broader impulsive structure. Wave (3) of 3 (circled) has exhibited significant strength, and within this wave, the final phase (wave 5 of (3)) is nearing completion. This implies that while the uptrend remains intact, the market could soon experience a period of consolidation or a minor corrective pullback before resuming its upward trajectory.
In the short term, gold is likely to continue its advance toward new highs. Traders should focus on entering during pullbacks to optimize profit potential. Long-term buyers are advised to hold their positions as wave (V) continues to unfold.
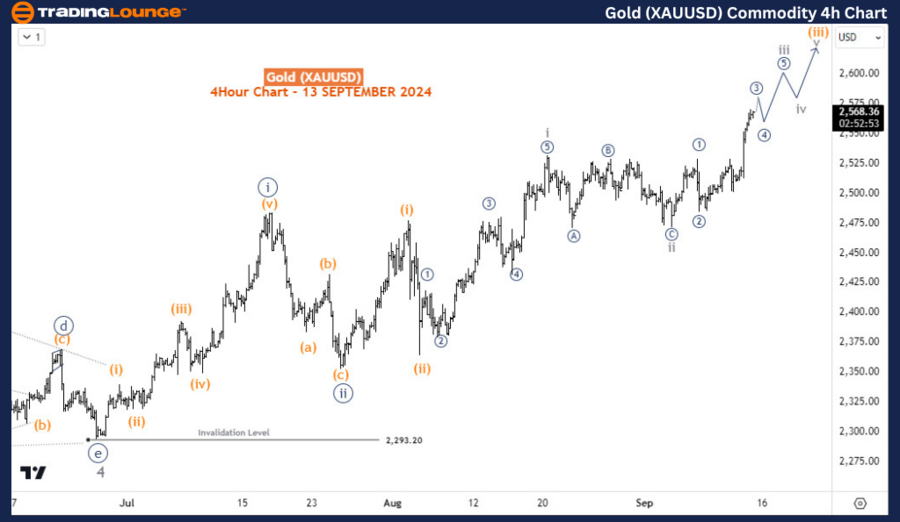
Gold (XAUUSD) Commodity H4 Chart Analysis
On the H4 chart, the structure of wave 5 of (3) is more distinct. The sub-waves that form this final phase began to take shape in late June 2024. At this stage, waves i and ii (circled) within wave 5 of (3) have already completed, and gold is currently advancing in wave iii (circled).
Further zooming into wave iii (circled), we observe that the price is in wave iii of (iii), which is typically the most powerful part of an impulse wave. This sub-wave is expected to drive gold prices toward the 2750 level in the coming weeks. However, traders should avoid entering positions at the current highs, as the risk of a near-term pullback remains. Waiting for corrections will provide better opportunities to enter long positions.
Technical Analyst: Sanmi Adeagbo
Source: visit Tradinglounge.com and learn From the Experts Join TradingLounge Here
See Previous: Natural Gas Elliott Wave Technical Analysis
Special Trial Offer - 0.76 Cents a Day for 3 Months! Click here
Access 7 Analysts Over 200 Markets Covered. Chat Room With Support
Conclusion
Gold remains in a strong bullish trend, with the Elliott Wave structure pointing to further upside potential. The market is advancing in wave (3) of 3 (circled) of wave III, with the next major target around the 2750 level. While the broader trend remains bullish, traders should consider waiting for pullbacks before entering new long positions to minimize risk. Long-term investors can hold their positions, as the overall outlook continues to favor further gains.