08Jan

ITC LTD. Share Price Forecast: In-Depth Elliott Wave Analysis, Technical Insights, Resistance Levels, and Stock Market Predictions

ITC LTD – ITC (1D Chart) Elliott Wave Technical Analysis

ITC Elliott Wave Technical Analysis

Function: Counter Trend (Minor degree, Grey)

Mode: Corrective

Structure: Larger degree zigzag

Position: Minor Wave 3 Grey

Details: Minor Wave 3 is unfolding lower, with resistance at the 530 mark.

Invalidation Point: 530

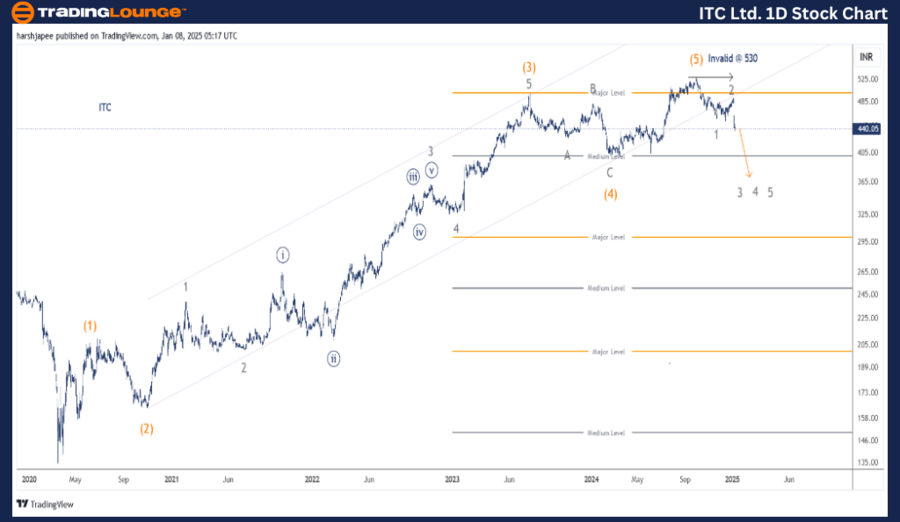
ITC Daily Chart Technical Analysis and Potential Elliott Wave Counts

The ITC daily chart suggests a potential trend reversal after reaching the 530 high in October 2024. The stock has declined below the 445 mark, forming Minor Waves 1 and 2 at approximately 455 and 490 levels, respectively.

In the larger picture, ITC saw a significant drop to 134 lows in March 2020. The subsequent recovery unfolded as follows:

  • Intermediate Wave (1) Orange: A leading diagonal ending near 209.
  • Wave (2): Corrective decline to 164.
  • Wave (3): An extended rally reaching 498.

The stock reversed sharply after Intermediate Wave (5) terminated near the 530 level. Currently, Minor Wave 3 is developing and is likely targeting 394 as a medium-term support zone.

ITC-LTD-1d-stock-cha...


ITC LTD – ITC (4H Chart) Elliott Wave Technical Analysis

Function: Counter Trend (Minor degree, Grey)

Mode: Corrective

Structure: Larger degree zigzag

Position: Minor Wave 3 Grey

Details: Minor Wave 3 is progressing downward, with resistance near 530 as Minor Wave 2 concluded as an expanded flat within the 490-500 range.

Invalidation Point: 530

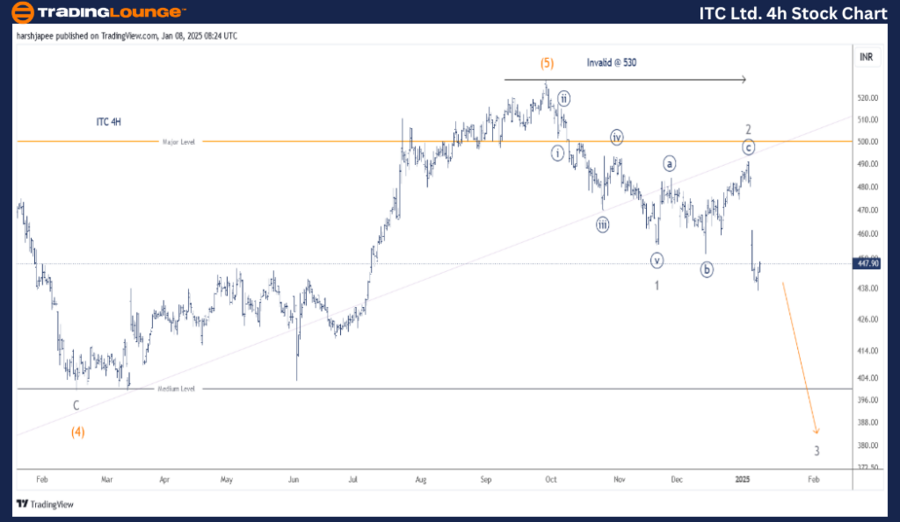
ITC 4H Chart Technical Analysis and Potential Elliott Wave Counts

The 4H chart reflects a trend reversal after Intermediate Wave (4) Orange ended near 400 in March 2024. The subsequent rally to Intermediate Wave (5) near 530 formed a strong impulse, which has since reversed.

Key observations:

  • Minor Wave 1: Formed near 455.
  • Minor Wave 2: An expanded flat correction ending around the 490-500 range.
  • Current Status: The stock is trading at 447 and unfolding Minor Wave 3 Grey, indicating further downside potential.

Technical Analyst: Harsh Japee

Source: visit Tradinglounge.com and learn From the Experts Join TradingLounge Here 

Previous: COAL INDIA Elliott Wave Technical Analysis

VALUE Offer - Buy 1 Month & Get 3 Months!Click here

Access 7 Analysts Over 200 Markets Covered. Chat Room With Support

ITC-LTD-4h-stock-cha...


Conclusion

ITC is in a corrective phase, moving lower within Minor Wave 3 against the 530 high, with key support expected near the 394 level.

Related

Visa Inc. (V) Stocks Elliott Wave Technical Analysis: Stock Trends, and Price Forecasts to Refine Your Trading Decisions

Visa Inc. (V) Stocks Elliott Wave Technical Analysis: Stock Trends, and Price Forecasts to Refine Your Trading Decisions

Discover the latest Elliott Wave Analysis for Visa Inc. (V), focusing on daily and 1-hour charts. Le...

Read More >
Unlocking Commodities Market Opportunities: USD DXY Analysis and Strategic Insights

Unlocking Commodities Market Opportunities: USD DXY Analysis and Strategic Insights

The Commodities Market is on the verge of change as the USD DXY undergoes an Elliott Wave ABC correc...

Read More >
Unlocking ASX Trading Success: SUNCORP GROUP LIMITED – SUN Stock Analysis & Elliott Wave Technical Forecast

Unlocking ASX Trading Success: SUNCORP GROUP LIMITED – SUN Stock Analysis & Elliott Wave Technical Forecast

(Suncorp Group Limited) provides a detailed Elliott Wave breakdown, including price targets, wave st...

Read More >
Swiss Market Index Elliott Wave Technical Analysis: Key Insights for Daily and Weekly Chart Trends

Swiss Market Index Elliott Wave Technical Analysis: Key Insights for Daily and Weekly Chart Trends

The Swiss Market Index (SMI) Elliott Wave Analysis provides a detailed look at current market trends...

Read More >

$1 for 2 Weeks

then $29 a month!

What a Special Offer!

Trade Recommendations

Unleash the power of deversified trading with our comprehensive portfolio, covering 250+ markets:

  • Stock Trades
  • Crypto Trades
  • Forex Trades
  • Commodity Trades
Elliott Wave Analysis

Gain a competitive edge with expert insights and AI-powered Elliott Wave charting into:

  • Global Indices
  • US Stocks & ASX Stocks
  • Forex & Crypto
  • Commodities
Top-Notch Trading Tools

Equip yourself with the tools of success:

  • Real-time Chat rooms
  • Elliott Wave Algorithm
  • Portfolio tools
  • TradingLevels
  • Screener
  • Trading Game
7 Elliott Wave Analysts

Stay ahead of the market with daily charts and insightful videos
Your secret to strategic trading!

JOIN HERE


Welcome to TradingLounge (ASIC A.R.No. 321187), specialists in trades, trading education and technical analysis, covering stocks, indices, commodities, forex and cryptocurrencies.

When you join TradingLounge you have access to everything we offer, including trade tools, educational content and a social platform to chat with like-minded investors.

Read more

@Copyright 2024 by tradinglounge.com

Contact Us

Australian no: 02 4787 6020

International no: +61 (2) 47876020

Pay with:

Find us on