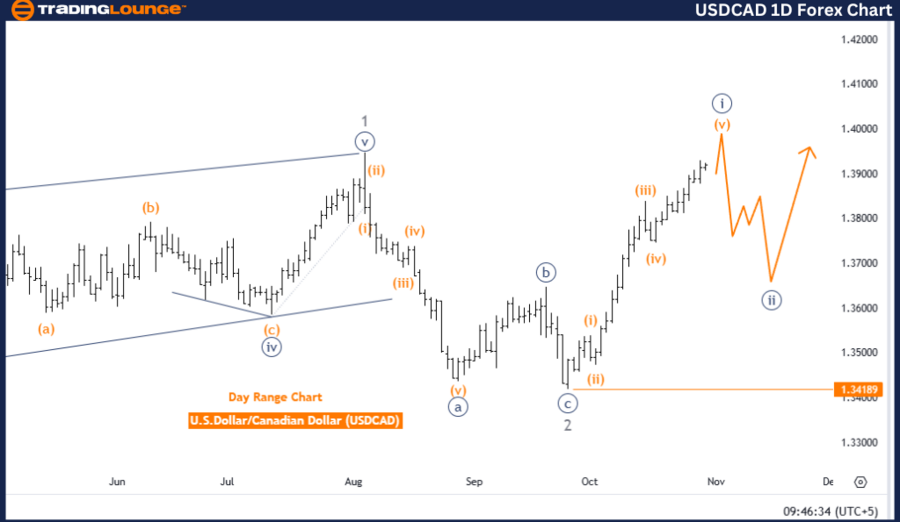
USDCAD Elliott Wave Analysis – Trading Lounge Day Chart
U.S. Dollar / Canadian Dollar (USDCAD) Day Chart Analysis
USDCAD Elliott Wave Technical Analysis
Function: Bullish Trend
Mode: Impulsive
Structure: Navy Blue Wave 1
Position: Gray Wave 3
Direction for Next Lower Degrees: Navy Blue Wave 2
Details: Navy Blue Wave 1 remains active, nearing its completion.
Wave Cancellation Level: 1.34189
The daily USDCAD Elliott Wave analysis reveals a sustained bullish trend in an impulsive mode, specifically within navy blue wave 1, positioned in gray wave 3. This analysis indicates an early upward phase for USDCAD, following an impulsive pattern that reflects significant bullish momentum.
Navy blue wave 1 is actively moving upward and approaching its peak. Given its current position within gray wave 3, this wave structure supports the forecast for further gains in USDCAD, reinforced by the strong impulsive characteristics of navy blue wave 1. This phase generally reflects a rise in price, propelled by sustained buying interest.
Upon completion of navy blue wave 1, a transition to navy blue wave 2 is anticipated, initiating a corrective phase. This correction could ease some of the bullish momentum established in navy blue wave 1, allowing for potential consolidation before any resumption of the upward trend.
The wave cancellation level is set at 1.34189, marking a critical point of validation. If USDCAD dips below this level, the current Elliott Wave count will be invalidated, necessitating a reevaluation of the wave structure. However, remaining above this threshold maintains the bullish outlook.
Summary: The daily USDCAD analysis reflects a persistent bullish Elliott Wave structure, with navy blue wave 1 nearing completion in an impulsive mode. The forecasted formation of navy blue wave 2 points to an impending corrective phase following recent bullish movement. The 1.34189 level serves as a key validation threshold, preserving the bullish wave count as long as prices remain above this point.
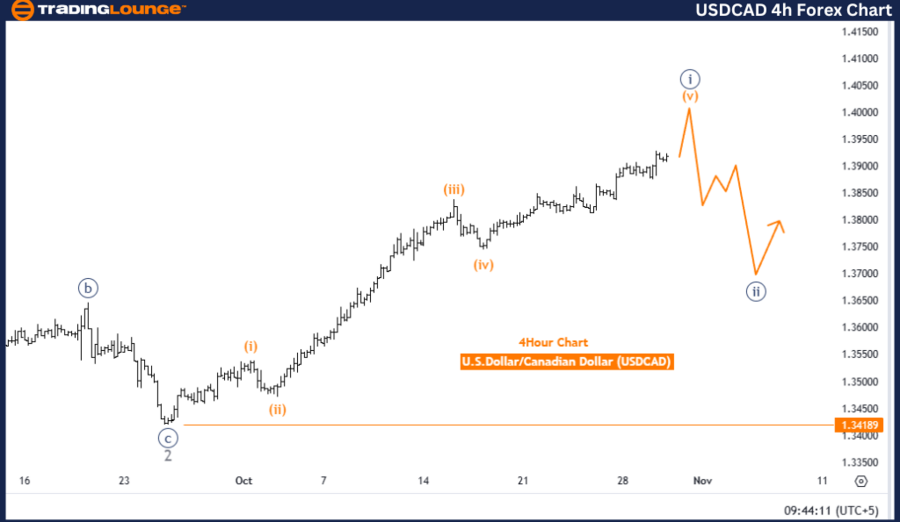
U.S. Dollar / Canadian Dollar (USDCAD) 4-Hour Chart
USDCAD Forex Pair Technical Analysis
Function: Bullish Trend
Mode: Impulsive
Structure: Orange Wave 5
Position: Navy Blue Wave 1
Direction for Next Lower Degrees: Navy Blue Wave 2
Details: Orange wave 4 appears complete, with orange wave 5 of 1 now active.
Wave Cancellation Level: 1.34189
The four-hour Elliott Wave analysis for USDCAD highlights a bullish trend in an impulsive mode, currently focusing on orange wave 5 within the broader framework of navy blue wave 1. This setup suggests the market is approaching the final stages of the initial navy blue wave 1 sequence, with orange wave 5 now actively moving upward.
Orange wave 4 has seemingly concluded its corrective phase, allowing orange wave 5 within navy blue wave 1 to progress. This impulsive movement indicates ongoing momentum in USDCAD, in line with the larger bullish trend identified in this timeframe. The positioning within navy blue wave 1 supports this upward push, marking the beginning of a bullish Elliott Wave cycle, typically marked by solid buying activity and decisive price action.
The next shift anticipated at a lower degree involves a transition to navy blue wave 2, likely introducing a corrective phase after navy blue wave 1 concludes. This phase could provide consolidation or retracement following the impulsive rise of navy blue wave 1, typically featuring pullbacks as part of the larger bullish cycle.
The wave cancellation level stands at 1.34189. Should prices fall below this level, the current Elliott Wave count would be invalidated, requiring a reevaluation of the wave structure. Maintaining levels above this threshold, however, supports the continuation of the current bullish wave outlook.
Summary: The USDCAD four-hour analysis presents a bullish Elliott Wave structure with an active impulsive movement in orange wave 5 within navy blue wave 1. This trend appears likely to persist, with upward momentum projected until the formation of navy blue wave 2 initiates. The critical level of 1.34189 acts as a validation threshold, upholding the bullish perspective as long as prices stay above this point.
Technical Analyst: Malik Awais
Source: visit Tradinglounge.com and learn From the Experts Join TradingLounge Here
Previous: AUDUSD Elliott Wave Technical Analysis
VALUE Offer - Buy 1 Month & Get 3 Months!Click here
Access 7 Analysts Over 200 Markets Covered. Chat Room With Support