Elliott Wave Analysis for PayPal Holdings Inc. (PYPL) – Daily and 1-Hour Chart Overview
This Elliott Wave analysis for PayPal Holdings Inc. (PYPL) provides insights into both the daily and 1-hour chart structures, emphasizing the prevailing trends and potential future price action for PYPL.
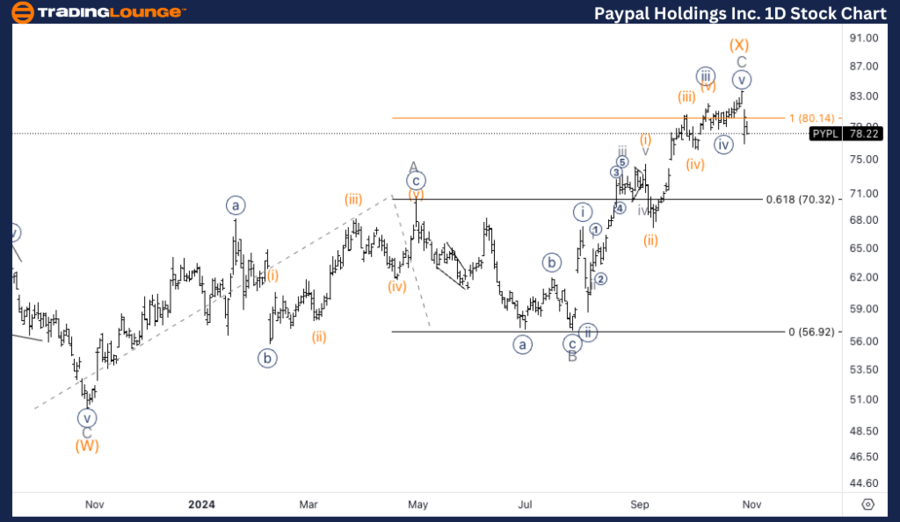
PYPL Elliott Wave Analysis - Tradinglounge Daily Chart
PayPal Holdings Inc. (PYPL) Daily Chart Analysis
PYPL Elliott Wave Technical Analysis
Technical Analysis Summary: Counter Trend
Wave Mode: Corrective
Wave Structure: Complex
Current Position: Wave (Y)
Market Direction: Potential Top in Wave (Y)
Detailed Analysis: The daily chart for PYPL suggests a complex corrective structure forming in Wave (Y). Observing a three-wave move within Wave (Y) indicates a possible top. Pending further confirmation, there remains an alternate scenario where this sequence could be a 1-2-3 impulsive move rather than a corrective one.

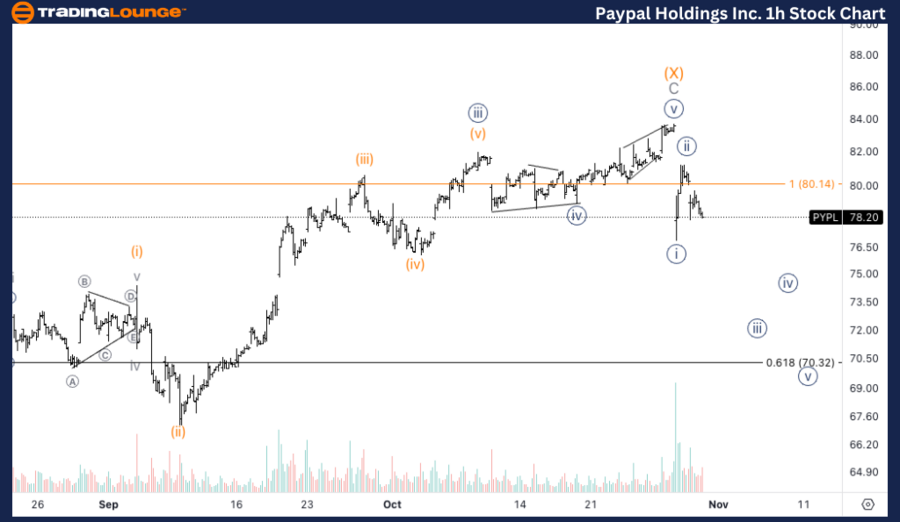
PYPL Elliott Wave Analysis – 1-Hour Chart
PayPal Holdings Inc. (PYPL) 1-Hour Chart Analysis
Technical Analysis Summary: Counter Trend
Wave Mode: Corrective
Wave Structure: Complex
Current Position: Wave {i} of A
Market Direction: Downside Continuation in Wave {iii}
Detailed Analysis: In the 1-hour chart, PYPL appears to be entering a new downside phase, likely progressing within Wave {iii} of A in a corrective pattern. Volume levels suggest that the initial movement downwards might mark the start of a more extended trend, potentially in either Wave {iii} or Wave {c}. The analysis remains focused on a continuation lower to complete the overall corrective sequence.
Technical Analyst: Alessio Barretta
Source: visit Tradinglounge.com and learn From the Experts Join TradingLounge Here
See Previous: Caterpillar Inc. (CAT) Elliott Wave Technical Analysis
VALUE Offer - Buy 1 Month & Get 3 Months!Click here
Access 7 Analysts Over 200 Markets Covered. Chat Room With Support
