26Nov

ASX: Santos Limited (STO) Stock Analysis & Elliott Wave Technical Forecast with Key Trends and Actionable Trading Strategies

ASX: SANTOS LIMITED - STO Elliott Wave Analysis TradingLounge 1D Chart

Greetings! Today's Elliott Wave analysis focuses on the Australian Stock Exchange (ASX), specifically SANTOS LIMITED (ASX: STO). Our analysis indicates that ASX: STO is likely to push lower before initiating an upward movement with the ((3))-navy wave.

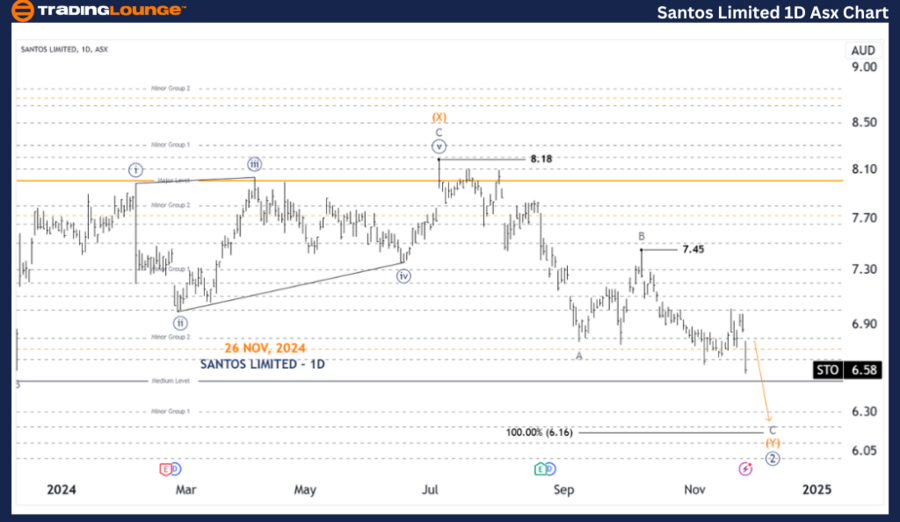
ASX: SANTOS LIMITED - STO 1D Chart (Semilog Scale) Analysis

SANTOS LIMITED - STO Elliott Wave Technical Analysis

Function: Major Trend (Minor Degree, Gray)

Mode: Motive

Structure: Impulse

Position: Wave C-gray of Wave (Y)-orange of Wave ((2))-navy

Details: Wave ((2))-navy continues to extend longer than initially anticipated. However, we foresee one more downward push before wave ((3))-navy begins its upward trajectory. The target remains around 6.16, where Wave C-gray equals Wave A-gray.

Invalidation Point: 7.45

SANTOS-LIMITED-1D-As...


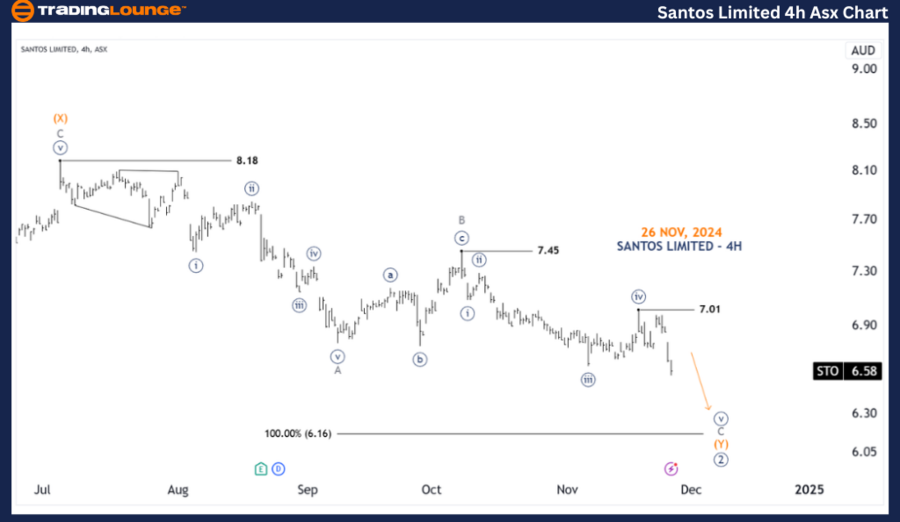
ASX: SANTOS LIMITED - STO 4-Hour Chart Analysis

Function: Counter-Trend (Primary Degree, Navy)

Mode: Corrective

Structure: Double Zigzag

Position: Wave (v)-navy of Wave C-gray of Wave (Y)-orange of Wave ((2))-navy

Details:

Since reaching the 7.45 high, Wave C-gray is progressing lower as a five-wave sequence from wave ((i))-navy to wave ((v))-navy. The movement is likely to continue downward, targeting the 6.16 low. However, price must remain below 7.01 to maintain this outlook. Breaking above 7.01 would be the first indication of wave ((3))-navy potentially unfolding.

Invalidation Point: 7.01

Technical Analyst: Hua (Shane) Cuong, CEWA-M (Master’s Designation).

Source: visit Tradinglounge.com and learn From the Experts Join TradingLounge Here 

See Previous: WOODSIDE ENERGY GROUP LTD - WDS Elliott Wave Technical Analysis

VALUE Offer - Buy 1 Month & Get 3 Months!Click here

Access 7 Analysts Over 200 Markets Covered. Chat Room With Support

SANTOS-LIMITED-4h-As...


Conclusion

This analysis delivers an in-depth perspective on ASX: SANTOS LIMITED - STO's Elliott Wave trends. By outlining critical price points as validation and invalidation signals, we enhance confidence in our wave count forecast. Our objective is to empower readers with actionable insights into current market dynamics, helping them navigate opportunities with clarity and precision.

Related

Examines the Lululemon athletica Inc. Stock's Current Trend Structure and Price Forecasts based on Elliott Wave Technical Analysis

Examines the Lululemon athletica Inc. Stock's Current Trend Structure and Price Forecasts based on Elliott Wave Technical Analysis

This comprehensive Elliott Wave analysis of Lululemon Athletica Inc. (LULU) examines the stock's...

Read More >
Stocks Bullish: AAPL, AMZN, NVDA, TSLA, GOOGL, META, NFLX, MSFT, Elliott Wave Analysis

Stocks Bullish: AAPL, AMZN, NVDA, TSLA, GOOGL, META, NFLX, MSFT, Elliott Wave Analysis

Following a robust Friday close, a positive momentum is anticipated for Monday's market. Several...

Read More >
Australian Dollar/U.S. Dollar (AUDUSD) Elliott Wave Analysis: Forecast Trends and Market Outlook for Forex Traders

Australian Dollar/U.S. Dollar (AUDUSD) Elliott Wave Analysis: Forecast Trends and Market Outlook for Forex Traders

AUDUSD Elliott Wave analysis provides a detailed outlook on market trends, including wave counts, tr...

Read More >
Comprehensive Mahindra & Mahindra Stock Analysis and Elliott Wave Forecast for Future Share Price Predictions

Comprehensive Mahindra & Mahindra Stock Analysis and Elliott Wave Forecast for Future Share Price Predictions

Explore Mahindra & Mahindra stock analysis with detailed Elliott Wave analysis, share price predicti...

Read More >
Stocks Bullish Trend: NASDAQ, AAPL, AMZN, NVDA, TSLA, GOOGL, META, NFLX, MSFT, Elliott Wave Analysis

Stocks Bullish Trend: NASDAQ, AAPL, AMZN, NVDA, TSLA, GOOGL, META, NFLX, MSFT, Elliott Wave Analysis

NASDAQ Stock market Elliott Wave analysis and trading strategies: NASDAQ 100, Apple (AAPL), Tesla (T...

Read More >
Bharat Electricals Stock Analysis – BEL Stocks Elliott Wave Technical Analysis Including Daily and 4H Chart Insights

Bharat Electricals Stock Analysis – BEL Stocks Elliott Wave Technical Analysis Including Daily and 4H Chart Insights

This article provides a comprehensive Elliott Wave analysis of Bharat Electricals (BEL) stock, inclu...

Read More >

$1 for 2 Weeks

then $29 a month!

What a Special Offer!

Trade Recommendations

Unleash the power of deversified trading with our comprehensive portfolio, covering 250+ markets:

  • Stock Trades
  • Crypto Trades
  • Forex Trades
  • Commodity Trades
Elliott Wave Analysis

Gain a competitive edge with expert insights and AI-powered Elliott Wave charting into:

  • Global Indices
  • US Stocks & ASX Stocks
  • Forex & Crypto
  • Commodities
Top-Notch Trading Tools

Equip yourself with the tools of success:

  • Real-time Chat rooms
  • Elliott Wave Algorithm
  • Portfolio tools
  • TradingLevels
  • Screener
  • Trading Game
7 Elliott Wave Analysts

Stay ahead of the market with daily charts and insightful videos
Your secret to strategic trading!

JOIN HERE


Welcome to TradingLounge (ASIC A.R.No. 321187), specialists in trades, trading education and technical analysis, covering stocks, indices, commodities, forex and cryptocurrencies.

When you join TradingLounge you have access to everything we offer, including trade tools, educational content and a social platform to chat with like-minded investors.

Read more

@Copyright 2024 by tradinglounge.com

Contact Us

Australian no: 02 4787 6020

International no: +61 (2) 47876020

Pay with:

Find us on