28May

Comprehensive ITC India Elliott Wave Analysis Reveals Bullish Trend with Detailed Price Forecast and Technical Insights

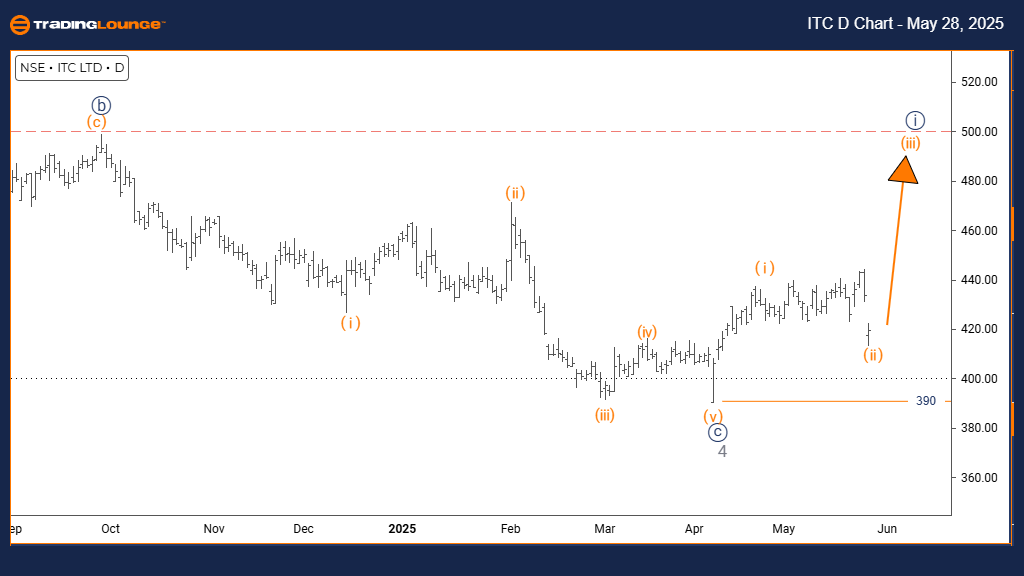
ITC INDIA Elliott Wave Analysis – Trading Lounge Day Chart

ITC INDIA Stock Day Chart Analysis

ITC India Elliott Wave Technical Analysis

FUNCTION: Bullish Trend

MODE: Impulsive

STRUCTURE: Orange Wave 3

POSITION: Navy Blue Wave 1

DIRECTION (NEXT HIGHER DEGREES): Orange Wave 3 (initiated)

Wave Cancel Invalid Level: 390

DETAILS: Orange wave 2 has concluded, signaling the initiation of orange wave 3.

The daily chart of ITC India reflects robust bullish momentum, underscoring an ongoing upward trend. Currently, orange wave 3 is developing within navy blue wave 1, part of a larger Elliott Wave cycle. This progression confirms the end of the corrective phase in orange wave 2 and introduces a strong impulsive rally characteristic of wave 3.

Orange wave 3 typically displays powerful buying interest, affirming market strength. Being embedded within navy blue wave 1, this scenario increases the likelihood of additional price appreciation. The 390 level acts as a pivotal support point—dropping below would challenge the current wave count and may indicate a deeper market correction or trend reversal.

This Elliott Wave setup provides technical traders with a clear understanding of ITC’s bullish positioning. With orange wave 3 gaining strength, the potential for upward movement remains strong in the near term.

Investors should monitor the ongoing price trend for evidence supporting the continuation of wave 3. Maintaining levels above 390 will reinforce the bullish outlook.

ITC-Indian-Stocks-da...


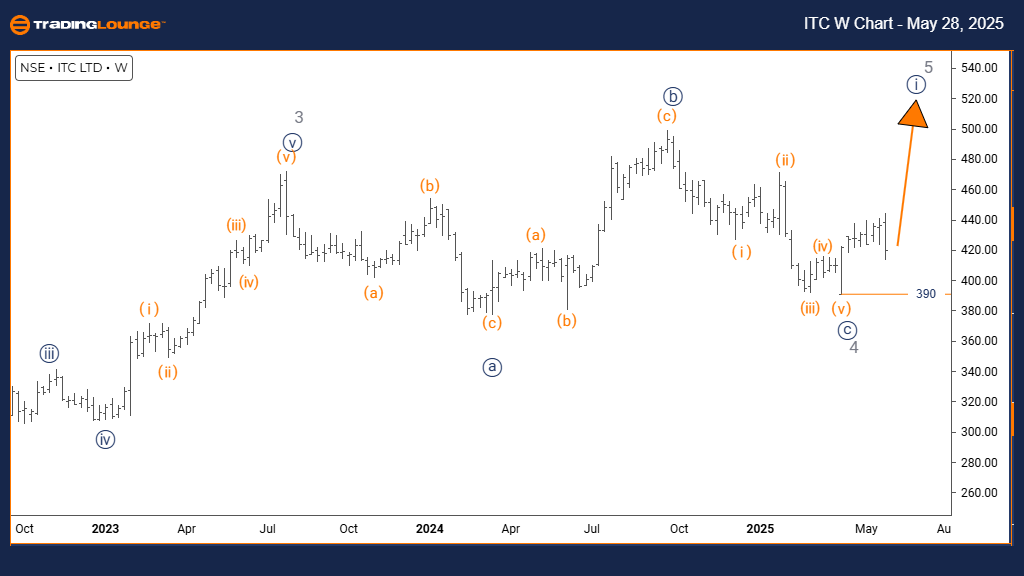
ITC INDIA Elliott Wave Analysis – Trading Lounge Weekly Chart

ITC India Elliott Wave Technical Analysis

FUNCTION: Bullish Trend

MODE: Impulsive

STRUCTURE: Navy Blue Wave 1

POSITION: Gray Wave 5

DIRECTION (NEXT LOWER DEGREES): Navy Blue Wave 2 (expected)

Wave Cancel Invalid Level: 390

DETAILS: The end of gray wave 4 implies the onset of navy blue wave 1 inside gray wave 5.

On the weekly timeframe, ITC India maintains a strong bullish structure. Navy blue wave 1 is forming as part of gray wave 5, confirming the completion of gray wave 4’s correction. This movement suggests that the stock is in the final impulse leg before a potential market adjustment or trend shift.

Navy blue wave 1 carries impulsive strength, indicating continued investor interest and bullish sentiment. However, as this wave aligns with the final gray wave 5, it may signal that the upward trend is nearing its maturity. The 390 price level remains the critical support; a drop beneath this threshold would challenge the current bullish scenario.

This wave analysis offers valuable insights into ITC’s position within the broader market cycle. While short-term gains remain possible, the market is approaching a point where reversal or consolidation is statistically likely.

Traders should stay alert for signs indicating the completion of navy blue wave 1 and track the 390 level closely. The weekly chart suggests prudent risk management as the asset trades within the higher segment of wave 5.

Technical Analyst: Malik Awais

Source: Visit Tradinglounge.com and learn from the Experts. Join TradingLounge Here 

Previous: Coal India Elliott Wave Technical Analysis

VALUE Offer - Buy 1 Month & Get 3 Months!Click here

Access 7 Analysts Over 200 Markets Covered. Chat Room With Support

ITC-w-indian-stock-c...

Related

Bitcoin Crypto Price News Today Elliott Wave Technical Analysis: Offering valuable insights into current market trends for BTCUSD

Bitcoin Crypto Price News Today Elliott Wave Technical Analysis: Offering valuable insights into current market trends for BTCUSD

This article provides an in-depth Elliott Wave analysis of Bitcoin against the U.S. dollar (BTCUSD),...

Read More >
Caterpillar Inc.(CAT) Stocks Elliott Wave Technical Analysis: Highlights key Fibonacci retracement levels and potential reversal points

Caterpillar Inc.(CAT) Stocks Elliott Wave Technical Analysis: Highlights key Fibonacci retracement levels and potential reversal points

Our Elliott Wave analysis of Caterpillar Inc. (CAT) stock provides traders with detailed insights in...

Read More >
Silver Elliott Wave Analysis: Price Forecast, Market Trends, Technical Analysis, and Trading Strategy for 2025

Silver Elliott Wave Analysis: Price Forecast, Market Trends, Technical Analysis, and Trading Strategy for 2025

Silver remains in a bullish Elliott Wave cycle, with potential to break above $40 in the coming week...

Read More >
XRP Elliott Wave Forecast: Price Prediction Targets Wave 3 Breakout with Strong Upside and Clear Swing Trade Strategy

XRP Elliott Wave Forecast: Price Prediction Targets Wave 3 Breakout with Strong Upside and Clear Swing Trade Strategy

XRP has likely completed its corrective wave (II) and is now entering a bullish wave (III) phase. Ex...

Read More >
In-Depth Elliott Wave Technical  Analysis and Strategic Price Forecast:Copper Commodity

In-Depth Elliott Wave Technical Analysis and Strategic Price Forecast:Copper Commodity

Delve into our in-depth Copper Elliott Wave analysis for June 2024. This report provides a thorough ...

Read More >
Advanced Forex Trading Strategies: U.S.Dollar /Canadian Dollar (USD/CAD) Forex Elliott Wave Technical Analysis

Advanced Forex Trading Strategies: U.S.Dollar /Canadian Dollar (USD/CAD) Forex Elliott Wave Technical Analysis

This detailed USD/CAD Elliott Wave analysis provides traders with essential insights into the curren...

Read More >

$1 for 2 Weeks

then $29 a month!

What a Special Offer!

Trade Recommendations

Unleash the power of deversified trading with our comprehensive portfolio, covering 250+ markets:

  • Stock Trades
  • Crypto Trades
  • Forex Trades
  • Commodity Trades
Elliott Wave Analysis

Gain a competitive edge with expert insights and AI-powered Elliott Wave charting into:

  • Global Indices
  • US Stocks & ASX Stocks
  • Forex & Crypto
  • Commodities
Top-Notch Trading Tools

Equip yourself with the tools of success:

  • Real-time Chat rooms
  • Elliott Wave Algorithm
  • Portfolio tools
  • TradingLevels
  • Screener
  • Trading Game
7 Elliott Wave Analysts

Stay ahead of the market with daily charts and insightful videos
Your secret to strategic trading!

JOIN HERE


Welcome to TradingLounge (ASIC A.R.No. 321187), specialists in trades, trading education and technical analysis, covering stocks, indices, commodities, forex and cryptocurrencies.

When you join TradingLounge you have access to everything we offer, including trade tools, educational content and a social platform to chat with like-minded investors.

Read more

@Copyright 2024 by tradinglounge.com

Contact Us

Australian no: 02 4787 6020

International no: +61 (2) 47876020

Pay with:

Find us on