17Apr

Grayscale Ethereum Trust ETF – ETHE U.S ETF Elliott Wave Technical Analysis Shows Bearish Wave (v) Setup Ahead

Grayscale Ethereum Trust ETF – ETHE Elliott Wave Analysis - TradingLounge Daily Chart

Grayscale Ethereum Trust ETF Daily Chart Analysis

ETHE ETF Elliott Wave Technical Analysis

Function: Identifying the major trend

Mode: Motive

Structure: Impulse

Position: Wave [iii]

Direction: Downtrend

Details:
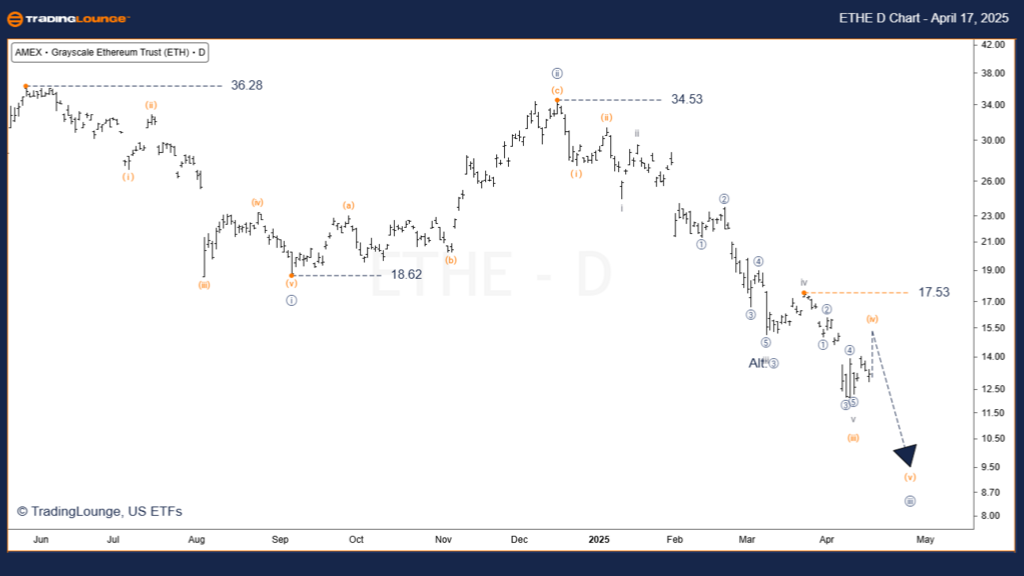
The Grayscale Ethereum Trust (ETHE) is in a clear downtrend, progressing through wave [iii] of a motive impulse. Fibonacci targets for wave (iii) of [iii] have now been reached, confirming the structure's strength.

Wave [iii] is currently unfolding in its final leg, as wave (iv) correction develops. This wave (iv) is expected to conclude within the next week, setting the stage for wave (v) to resume the downward impulse.

Invalidation Level: $22.00

ETHE-ETF-Day-Chart-1...


Grayscale Ethereum Trust ETF – ETHE (4H) Elliott Wave Technical Analysis Hourly Chart

Function: Tracking minor trends

Mode: Motive

Structure: Impulse

Position: Wave (iii) in orange

Direction: Downtrend

Details:
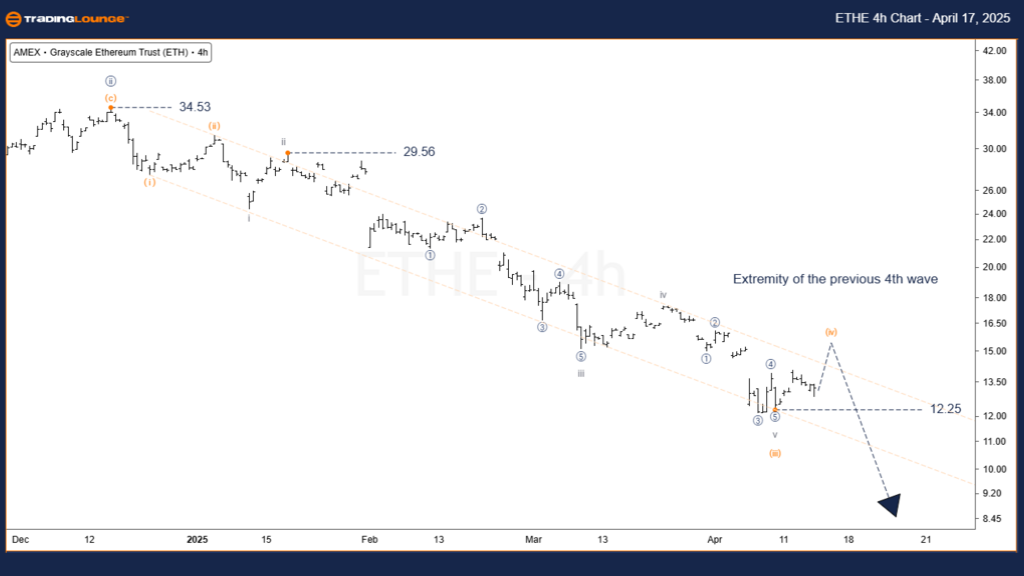
On the 4-hour chart, ETHE has begun a wave (iv) correction. Price is expected to consolidate near the previous wave 4 area of a lower degree, consistent with typical Elliott Wave guidelines.

Given the shallow nature of wave (ii), wave (iv) is also expected to be limited in depth. A price move above $14.97 would invalidate the current wave structure, suggesting that wave (iv) could already be underway or wave (v) is delayed.

Invalidation Level: $22.00

Technical Analyst: Simon Brooks

Source: Visit Tradinglounge.com and learn from the Experts. Join TradingLounge Here 

See Previous: VanEck Rare Earth & Strategic Metals ETF – REMX Elliott Wave Technical Analysis

VALUE Offer - Buy 1 Month & Get 3 Months!Click here

Access 7 Analysts Over 200 Markets Covered. Chat Room With Support

ETHE-ETF-4H-Chart-17...


Conclusion
ETHE has entered wave (iv), offering a potential short trade opportunity as wave (v) approaches.

The next decline could extend by at least $5 from current levels. While the Elliott Wave count remains intact up to $22.00, alternate scenarios will be reassessed if this level is breached.

Traders should remain alert and ready, using wave theory and key invalidation points to manage risk and time their entries effectively.

Related

The Coca-Cola Company (KO:NYSE) Elliott Wave Technical Analysis 13 December 23

The Coca-Cola Company (KO:NYSE) Elliott Wave Technical Analysis 13 December 23

The Coca-Cola Company (KO: NYSE) Elliott Wave Technical Analysis dated 13 December 23, KO Stock Mark...

Read More >
Bitcoin / U.S. dollar(BTCUSD) Elliott Wave Technical Analysis 21 November 23

Bitcoin / U.S. dollar(BTCUSD) Elliott Wave Technical Analysis 21 November 23

Bitcoin/U.S. dollar(BTCUSD) Elliott Wave Technical Analysis on 21 November 23 with BTCUSD Analysis D...

Read More >
Natural Gas Commodity Forecast: NG Elliott Wave Technical Analysis Predicts Bullish Rally | Rebounding Strongly Since April

Natural Gas Commodity Forecast: NG Elliott Wave Technical Analysis Predicts Bullish Rally | Rebounding Strongly Since April

Natural Gas has been rebounding strongly since April. Elliott Wave analysis shows a potential bullis...

Read More >
USDCHF Elliott Wave Technical Breakdown: Bearish Impulsive Wave 3 and Corrective Phase Insights for Smart Trading

USDCHF Elliott Wave Technical Breakdown: Bearish Impulsive Wave 3 and Corrective Phase Insights for Smart Trading

This analysis delivers a detailed breakdown of the USDCHF currency pair using Elliott Wave principle...

Read More >
Australian Dollar/U.S.Dollar Forex Currency Pair: AUDUSD Elliott Wave Technical Analysis Provides in-depth insights

Australian Dollar/U.S.Dollar Forex Currency Pair: AUDUSD Elliott Wave Technical Analysis Provides in-depth insights

Our comprehensive AUDUSD Elliott Wave Analysis provides in-depth insights into the current market tr...

Read More >
SGX TSI Iron Ore Commodity Elliott Wave Technical Analysis & Key Support Levels for Traders, Miners, and Steel Producers in 2025

SGX TSI Iron Ore Commodity Elliott Wave Technical Analysis & Key Support Levels for Traders, Miners, and Steel Producers in 2025

The SGX TSI Iron Ore Futures is a key benchmark for iron ore prices, widely used by traders, miners,...

Read More >

$1 for 2 Weeks

then $29 a month!

What a Special Offer!

Trade Recommendations

Unleash the power of deversified trading with our comprehensive portfolio, covering 250+ markets:

  • Stock Trades
  • Crypto Trades
  • Forex Trades
  • Commodity Trades
Elliott Wave Analysis

Gain a competitive edge with expert insights and AI-powered Elliott Wave charting into:

  • Global Indices
  • US Stocks & ASX Stocks
  • Forex & Crypto
  • Commodities
Top-Notch Trading Tools

Equip yourself with the tools of success:

  • Real-time Chat rooms
  • Elliott Wave Algorithm
  • Portfolio tools
  • TradingLevels
  • Screener
  • Trading Game
7 Elliott Wave Analysts

Stay ahead of the market with daily charts and insightful videos
Your secret to strategic trading!

JOIN HERE


Welcome to TradingLounge (ASIC A.R.No. 321187), specialists in trades, trading education and technical analysis, covering stocks, indices, commodities, forex and cryptocurrencies.

When you join TradingLounge you have access to everything we offer, including trade tools, educational content and a social platform to chat with like-minded investors.

Read more

@Copyright 2024 by tradinglounge.com

Contact Us

Australian no: 02 4787 6020

International no: +61 (2) 47876020

Pay with:

Find us on