In the realm of cryptocurrency trading, understanding DOGEUSD Elliott Wave Analysis can be a game-changer. Today, we delve into the intricacies of Dogecoin's market dynamics, employing Elliott Wave Theory to decipher trends and potential price movements.

Elliott Wave Analysis TradingLounge Daily Chart, 4 March 24,

DOGEUSD Elliott Wave Technical Analysis

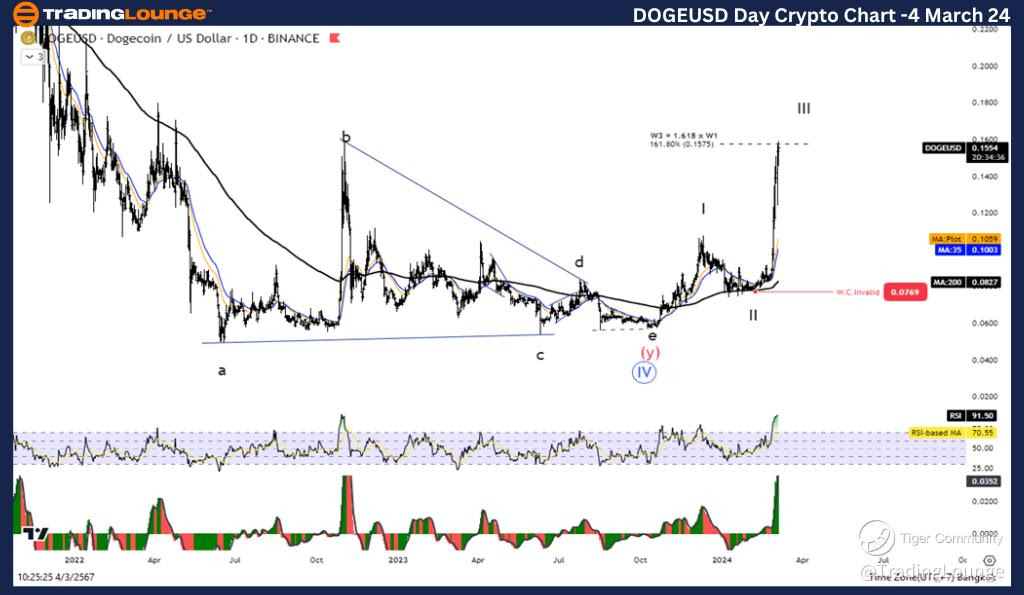
DOGEUSD Daily Chart Analysis

Function: Trend Tracking

Mode: Motive

Structure: Impulse

Position: Wave III

Direction Next Higher Degree: Wave (I) of Impulse Wave Cancel Invalid

Level: 0.0770 Key

Detail: Wave III projects to 161.8% of Wave I, reaching 0.1575

Dogecoin/ U.S. Dollar (DOGEUSD) Trading Strategy:

Dogecoin is currently riding the waves of a robust uptrend, predominantly characterized by the surge of Wave III, with a potential test of the 0.1575 level on the horizon. This firmly positions Dogecoin within an upward trajectory, presenting continuous growth opportunities.

Technical Indicators for DOGEUSD:

  • Price Action: Above MA200, signaling an established uptrend.
  • Wave Oscillator: Reflecting bullish momentum, reinforcing the positive outlook.
DOGEUSD-day-crypto-c...


Unlocking Insights with Elliott Wave Analysis: 4-Hour Chart Overview

Dogecoin/ U.S. Dollar (DOGEUSD) Elliott Wave Technical Analysis

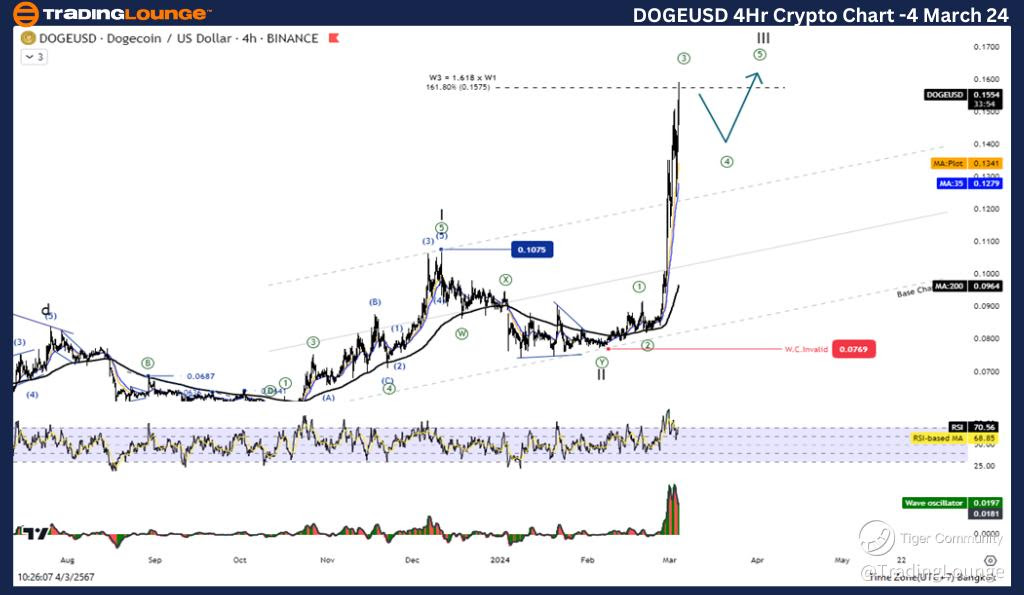
Dogecoin/ U.S. Dollar 4-Hour Chart Analysis

Function: Trend Tracking

Mode: Motive

Structure: Impulse

Position: Wave III

Direction Next Higher Degree: Wave (I) of Impulse Wave Cancel Invalid

Level: 0.0770 Key

Detail: Wave III projects to 161.8% of Wave I, reaching 0.1575

Dogecoin/ U.S. Dollar (DOGEUSD) Trading Strategy:

Mirroring the daily chart, Dogecoin continues its ascent within Wave III, poised to challenge the 0.1575 mark. This sustained uptrend reaffirms the overarching bullish sentiment surrounding Dogecoin, with further growth potential anticipated.

Technical Indicators for DOGEUSD:

  • Price Action: Maintains position above MA200, indicating a resilient uptrend.
  • Wave Oscillator: Exhibits bullish momentum, strengthening the case for continued upward movement.

Technical Analyst: Kittiampon Somboonsod, CEWA

Source: visit Tradinglounge.com and learn From the Experts Join TradingLounge Here 

See Previous: Bitcoin/ U.S. dollar(BTCUSD)

TradingLounge Once Off SPECIAL DEAL: Here > 1 month Get 3 months.   
DOGEUSD-4Hr-crypto-c...

Conclusion:

Harnessing the power of Elliott Wave Analysis provides invaluable insights into Dogecoin's trading landscape. With Wave III dominance and positive technical indicators, DOGEUSD presents compelling opportunities for traders seeking to capitalize on the cryptocurrency market's dynamics. Stay tuned for further updates as Dogecoin's journey unfolds amidst the waves of market sentiment and Elliott Wave principles.

Related

Comprehensive Stock Market Indices Analysis: S&P 500, NASDAQ 100, RUSSELL 2000, DAX 40, FTSE 100, ASX 200 | Elliott Wave Insights

Comprehensive Stock Market Indices Analysis: S&P 500, NASDAQ 100, RUSSELL 2000, DAX 40, FTSE 100, ASX 200 | Elliott Wave Insights

The S&P 500 and NASDAQ 100 are currently in a bullish Elliott Wave pattern, specifically in wave (ii...

Read More >
Texas Instruments Inc.(TXN:NASDAQ) Elliott Wave Technical Analysis 8 December 23

Texas Instruments Inc.(TXN:NASDAQ) Elliott Wave Technical Analysis 8 December 23

Texas Instruments Inc.(TXN: NASDAQ) Elliott Wave Technical Analysis with 4-Hour and 1-hour Chart dat...

Read More >
Wheat Commodity Elliott Wave Technical Analysis Explores Key Support, Resistance Levels, and Prices are in a Corrective Bounce

Wheat Commodity Elliott Wave Technical Analysis Explores Key Support, Resistance Levels, and Prices are in a Corrective Bounce

Wheat prices have bounced back but have remained in a long-term bearish trend since 2022. This Ellio...

Read More >
HDFC Life Insurance’s Stocks Forecast  And Elliott Wave Technical Analysis - Price Movements and Projected Resistance Levels

HDFC Life Insurance’s Stocks Forecast And Elliott Wave Technical Analysis - Price Movements and Projected Resistance Levels

This in-depth analysis covers HDFC Life Insurance’s stock forecast using Elliott Wave theory, highl...

Read More >
Unlocking ASX Trading Success: RESMED INC - RMD Stock Analysis & Elliott Wave Technical Forecast

Unlocking ASX Trading Success: RESMED INC - RMD Stock Analysis & Elliott Wave Technical Forecast

This detailed analysis of ASX-listed ResMed Inc (RMD) stock offers insights into current market tren...

Read More >
SBI LIFE INSURANCE CO. Stock Elliott Wave Technical Analysis: In-Depth Stock Forecast and Market Trends

SBI LIFE INSURANCE CO. Stock Elliott Wave Technical Analysis: In-Depth Stock Forecast and Market Trends

This analysis provides an in-depth look at SBI Life Insurance (SBILIFE) stock using Elliott Wave the...

Read More >

Buy 1 Month

Get 3 Months!

Special Offer:

Trade Recommendations

Unleash the power of deversified trading with our comprehensive portfolio, covering:

  • Stock Trades
  • Crypto Trades
  • Forex Trades
  • Commodity Trades
Elliott Wave Analysis

Gain a competive edge with expert insights in to:

  • Global Indices
  • US Stocks & ASX Stocks
  • Forex & Crypto
  • Commodities
Top-Notch Trading Tools

Equip yourself with the tools of success:

  • Social Chat
  • Elliott Wave Algorithm
  • Screener
  • TradingLevels
  • Trading Game
7 Elliott Wave Analysts

Stay ahead of the market with daily charts and insightful videos
-Your secret to strategic trading!

JOIN HERE


Welcome to TradingLounge (ASIC A.R.No. 321187), specialists in trades, trading education and technical analysis, covering stocks, indices, commodities, forex and cryptocurrencies.

When you join TradingLounge you have access to everything we offer, including trade tools, educational content and a social platform to chat with like-minded investors.

Read more

@Copyright 2024 by tradinglounge.com

Contact Us

Australian no: 02 4787 6020

International no: +61 (2) 47876020

Pay with:

Find us on