TradingLounge Daily Chart – CAT Elliott Wave Forecast
Caterpillar Inc – CAT Elliott Wave Daily Chart Forecast
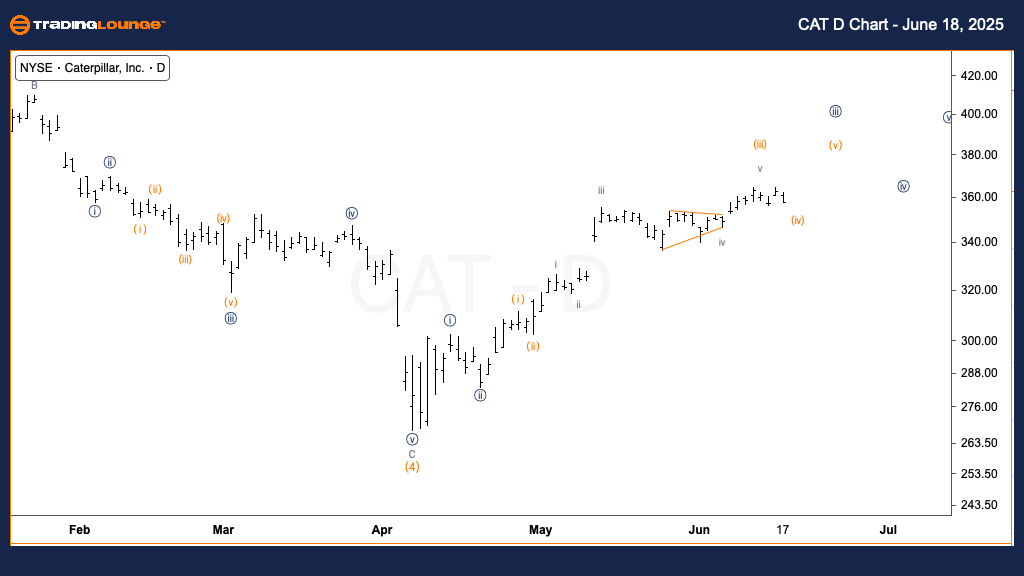
Caterpillar Inc. (CAT) Elliott Wave Forecast & Technical Analysis
Function: Trend Identification
Mode: Motive Wave
Structure: Impulsive Wave
Position: Wave (iv) of Minute Wave {iii}
Direction: Projected Upside Continuation into Wave (v)
Details: Wave (iv) appears nearly complete based on current market structure. The impulsive nature of wave {iii} signals potential upward continuation into wave (v). The long-term uptrend for Caterpillar Inc. (CAT) stock remains intact.
1-Hour Chart – Elliott Wave Forecast
Function: Short-Term Trend Analysis
Mode: Motive Wave
Structure: Impulsive Wave
Position: Wave c of (iv)
Direction: Likely Bottoming in Wave c
Details: One more downward leg in wave c is anticipated. Strong support is expected near the $350 level. A bullish reversal from this zone would confirm wave (iv) completion, opening potential upside toward $380—aligned with the MinorGroup2 resistance target.
Technical Analyst: Alessio Barretta
Source: Visit Tradinglounge.com and learn from the Experts. Join TradingLounge Here
Previous: The Walt Disney Co. (DIS) Elliott Wave Technical Analysis
VALUE Offer - $1 for 2 Weeks then $29 a month!Click here
Access 7 Analysts Over 200 Markets Covered. Chat Room With Support
