13Jan

ASX FPH Stock Analysis: Fisher & Paykel Healthcare Elliott Wave Forecast, Wave 4 Triangle Pattern, and Price Prediction Insights

ASX: Fisher & Paykel Healthcare Corporation Limited – FPH Elliott Wave Technical Analysis

Introduction

Welcome to our Elliott Wave analysis for the Australian Stock Exchange (ASX) Fisher & Paykel Healthcare Corporation Limited – FPH. Our latest insights suggest ASX:FPH is nearing the completion of a wave 4 Triangle pattern, setting the stage for a potential rally with wave 5. This technical analysis highlights key price levels and market movements to help you navigate the upcoming trends effectively.


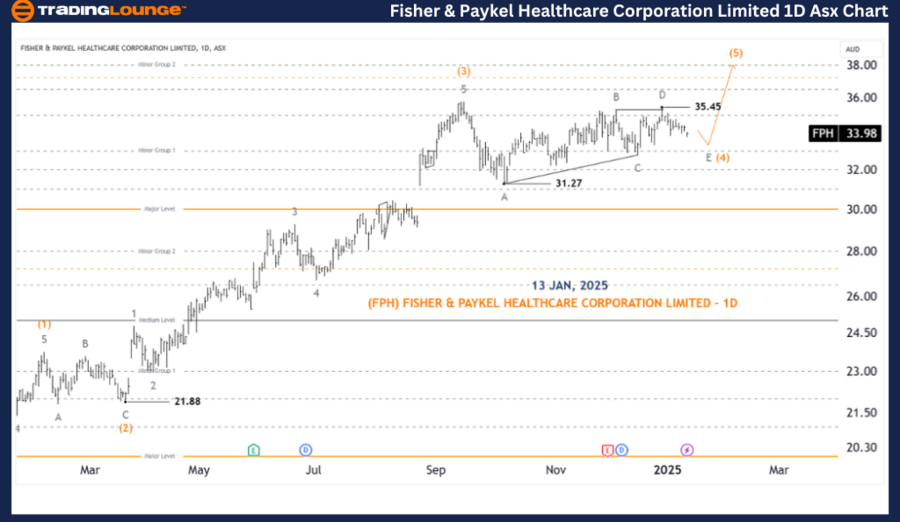
ASX: Fisher & Paykel Healthcare Corporation Limited – FPH 1D Chart Analysis(Semilog Scale)

Function: Major trend (Intermediate degree, orange)

Mode: Motive

Structure: Impulse

Position: Wave (4)-orange

Analysis Details:

  • The wave count has been adjusted for higher probability.
  • Wave (4)-orange is likely forming a Triangle, requiring additional time to complete.
  • Upon completion, wave (5)-orange is expected to push higher.
  • A breakout above 35.45 would signal the beginning of the wave (5)-orange move.

Key Price Levels:

  • Invalidation Point: The end of wave A-grey
  • Confirmation Point: 35.45

FPH-1d-asx-chart-130...


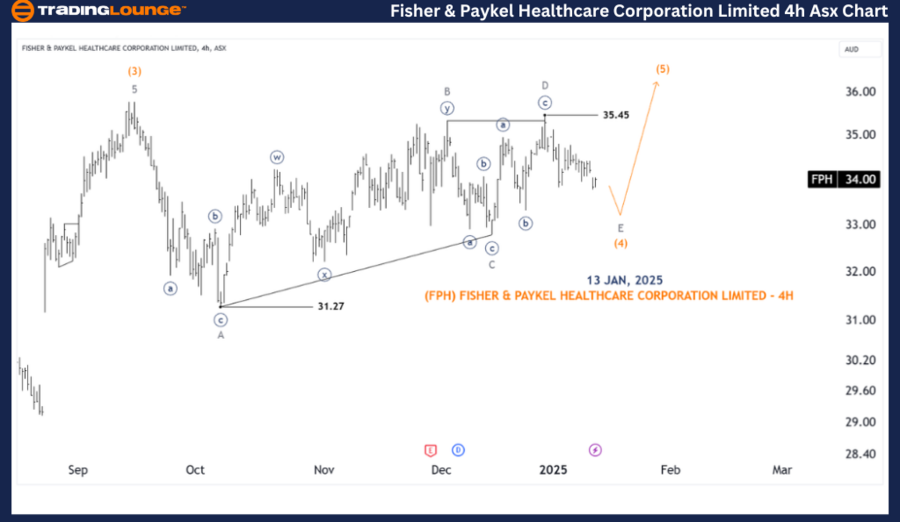
ASX: Fisher & Paykel Healthcare Corporation Limited – FPH 4-Hour Chart Analysis

Function: Major trend (Intermediate degree, orange)

Mode: Motive

Structure: Impulse

Position: Wave E-grey of Wave (4)-orange

Analysis Details:

  • The 4-hour chart provides a detailed look at the wave (4)-orange Triangle.
  • This phase is nearing completion, signaling a likely transition to wave (5)-orange.
  • A confirmed push above 35.45 would strengthen this bullish view.
  • Conversely, failure to breach 35.45 and a breakdown below wave C-grey would invalidate the bullish scenario.

Key Price Levels:

  • Invalidation Point: The end of wave C-grey
  • Confirmation Point: 35.45

Technical Analyst: Hua (Shane) Cuong, CEWA-M (Master’s Designation).

Source: visit Tradinglounge.com and learn From the Experts Join TradingLounge Here 

See Previous: Northern Star Resources Ltd – NST Elliott Wave Technical Analysis

VALUE Offer - Buy 1 Month & Get 3 Months!Click here

Access 7 Analysts Over 200 Markets Covered. Chat Room With Support

FPH-4h-asx-chart-130...


Conclusion

This Elliott Wave analysis for ASX: FPH provides insights into both the short-term and long-term trends. By identifying specific price points as validation or invalidation signals, we enhance the reliability of our wave count. Investors and traders can utilize this professional analysis to better anticipate market movements and capitalize on potential opportunities.

Related

USD/CAD Elliott Wave Analysis: Trading Insights on 4-Hour and Daily Charts - 9 February 24

USD/CAD Elliott Wave Analysis: Trading Insights on 4-Hour and Daily Charts - 9 February 24

Dated 9 February 24, our "USD/CAD Elliott Wave Analysis Trading Lounge 4 Hour Chart" sugge...

Read More >
Coffee Commodity Elliott Wave Technical Analysis Can Help Anticipate Coffee Price Rallies and Dips, Offering Valuable Insights

Coffee Commodity Elliott Wave Technical Analysis Can Help Anticipate Coffee Price Rallies and Dips, Offering Valuable Insights

Explore the current Coffee Elliott Wave analysis highlighting the ongoing bullish corrective cycle a...

Read More >
Stay updated with the latest price forecasts with Natural Gas Commodity Elliott Wave Technical Analysis

Stay updated with the latest price forecasts with Natural Gas Commodity Elliott Wave Technical Analysis

Explore our comprehensive analysis of natural gas prices using Elliott Wave theory. Understand marke...

Read More >
Understand Soybean Commodity Market with the Corrective Phase and Forecasted Price Targets Using Elliott Wave Technical Analysis

Understand Soybean Commodity Market with the Corrective Phase and Forecasted Price Targets Using Elliott Wave Technical Analysis

Explore an in-depth Elliott Wave analysis of Soybean prices, providing key insights into current mar...

Read More >
Comprehensive Elliott Wave Analysis: S&P 500, NASDAQ 100, DAX 40, and More - June 2024 Market Insights

Comprehensive Elliott Wave Analysis: S&P 500, NASDAQ 100, DAX 40, and More - June 2024 Market Insights

Today's analysis covers key stock market indices including the S&P 500, NASDAQ 100, Russell 2000...

Read More >
Elliott Wave Technical Analysis: Indices Overview S&P 500, NASDAQ 100, RUSSELL 2000, DAX 40, FTSE 100, ASX 200

Elliott Wave Technical Analysis: Indices Overview S&P 500, NASDAQ 100, RUSSELL 2000, DAX 40, FTSE 100, ASX 200

In this analysis, we take a comprehensive look at the S&P 500, NASDAQ 100, Russell 2000, DAX 40, FTS...

Read More >

Buy 1 Month

Get 3 Months!

Special Offer:

Trade Recommendations

Unleash the power of deversified trading with our comprehensive portfolio, covering:

  • Stock Trades
  • Crypto Trades
  • Forex Trades
  • Commodity Trades
Elliott Wave Analysis

Gain a competive edge with expert insights in to:

  • Global Indices
  • US Stocks & ASX Stocks
  • Forex & Crypto
  • Commodities
Top-Notch Trading Tools

Equip yourself with the tools of success:

  • Social Chat
  • Elliott Wave Algorithm
  • Screener
  • TradingLevels
  • Trading Game
7 Elliott Wave Analysts

Stay ahead of the market with daily charts and insightful videos
-Your secret to strategic trading!

JOIN HERE


Welcome to TradingLounge (ASIC A.R.No. 321187), specialists in trades, trading education and technical analysis, covering stocks, indices, commodities, forex and cryptocurrencies.

When you join TradingLounge you have access to everything we offer, including trade tools, educational content and a social platform to chat with like-minded investors.

Read more

@Copyright 2024 by tradinglounge.com

Contact Us

Australian no: 02 4787 6020

International no: +61 (2) 47876020

Pay with:

Find us on