Corn Commodity Elliott Wave Analysis: A Deep Dive into Market Trends
Corn Daily Chart Analysis
Corn Elliottwave Technical Analysis
Function: Trend Analysis
Mode: Counter-Trend Strategies
Structure: Anticipating Impulse Wave Development
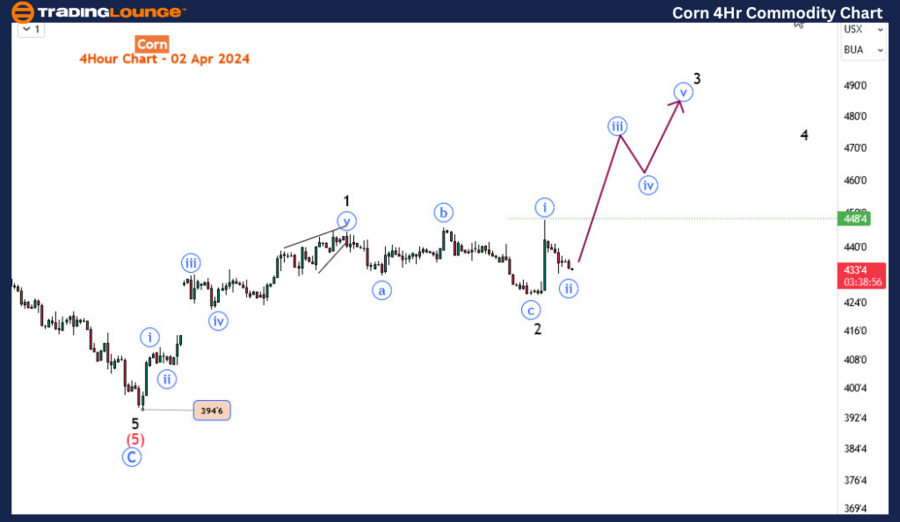
Position: Wave 3 Unfolds
Direction: The Ongoing Relevance of Wave 3
Details: Following the conclusion of Wave 2, the market's upward trajectory suggests the commencement of Wave 3. Surpassing the 448’4 mark will verify this, with an anticipated extension towards 480-517, completing the impulse from 394.
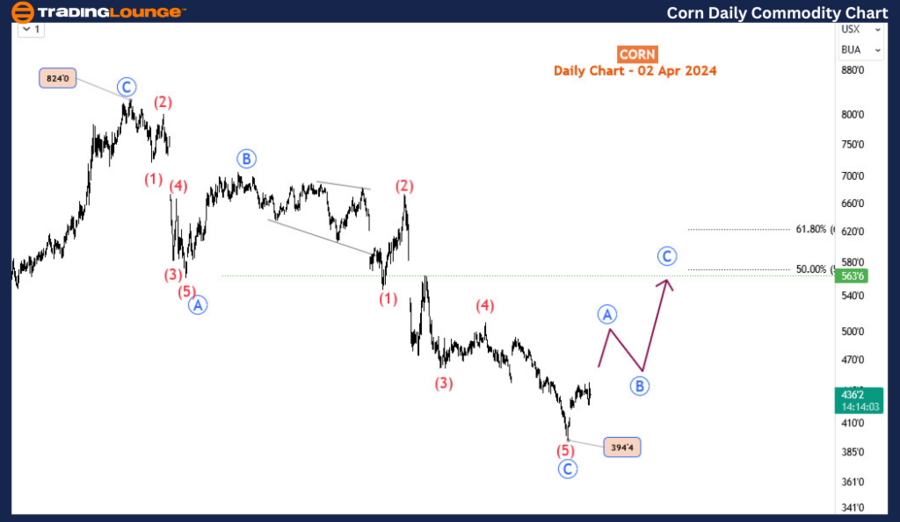
March witnessed a significant rebound in corn prices, marking a substantial recovery from late February's lows. Over a little more than a month, corn values surged by over 10%. Despite this rally, it's essential to place it within a broader perspective. From April 2022 to February 2024, corn prices plummeted by more than 50%. Therefore, while the recent gains are encouraging, they represent a modest correction within a more extended bearish period.
The chances of a full recovery from the two-year downturn seem slim, yet the current upward trend could continue for some time before facing opposition from bearish elements. This analysis aims to explore the current rebound's potential reach and provide strategic insights for traders looking to leverage this movement.
The daily chart reveals that the drop from the April 2022 peak of 824 to the February 2024 low of 394 might have traced an A-B-C pattern, hinting at the potential for a bearish impulse. It's plausible to expect a 3-wave corrective rally, aiming for a 23.6-38.3% Fibonacci retracement zone (470-524) against the April 2022 descent.
Corn Elliott Wave Analysis Trading Lounge 4-Hour Chart
Corn 4-Hour Chart Analysis:
On the H4 chart, we're witnessing the early stages of this 3-wave recovery. The end of the initial phase, labeled as Blue wave A on the daily chart, signals the completion of Wave 1, succeeded by a corrective Wave 2. The emergence of Wave 3 is indicated by a significant bullish candle, with a breakout above 448 serving as confirmation. If the market fails to maintain momentum above 448, or declines below 426, it suggests a deeper correction for Wave 2. Nonetheless, the primary expectation is for Wave 3 to propel the market higher from February 2024's levels, whether it begins above 448 or below 426, as long as the 394 low remains intact. Traders are advised to stay alert and adjust their strategies to the shifting market conditions.
Conclusion: The recent uptrend in corn prices provides a glimmer of hope following a prolonged bearish phase. While a full-scale recovery appears unlikely, the potential for continued gains remains. Traders should monitor key levels and be prepared to adjust their strategies in response to the market's evolving dynamics. The unfolding Elliott Wave pattern offers a roadmap for navigating the upcoming phases of this commodity's price movements, highlighting the importance of vigilance and strategic planning in achieving trading success.
Technical Analyst: Sanmi Adeagbo
Source: visit Tradinglounge.com and learn From the Experts Join TradingLounge Here
See Previous: Corn Commodity
TradingLounge Once Off SPECIAL DEAL: Here > 1 month Get 3 months.
TradingLounge's Free Week Extravaganza!
April 14 – 21: Unlock the Doors to Trading Excellence — Absolutely FREE!