28Nov

CAC 40 Trading: Expert Elliott Wave Analysis, Daily Market Updates, Investment Tips, and Top Stock Picks to Optimize Your Portfolio

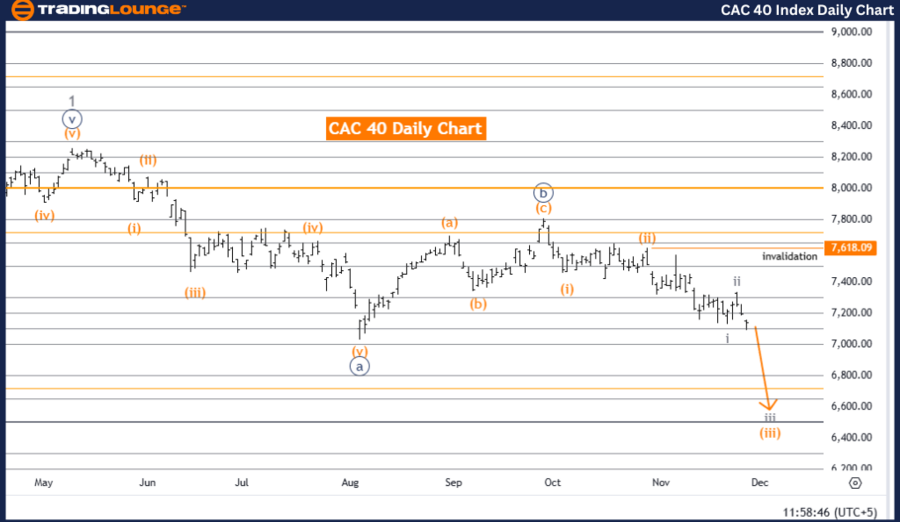
CAC 40 (France) Elliott Wave Analysis - TradingLounge Day Chart

CAC 40 (France) Elliott Wave Technical Analysis

CAC 40 Technical Details

Function: Bearish Trend

Mode: Impulsive

Structure: Gray Wave 3

Position: Orange Wave 3

Direction Next Higher Degrees: Gray Wave 4

Details: Gray wave 2 appears complete. Currently, gray wave 3 of orange wave 3 is developing.

Wave Cancel Invalidation Level: 7618.09

CAC 40 Analysis Overview

This Elliott Wave analysis for the CAC 40 Index focuses on the daily chart, highlighting a bearish trend. The market is in an impulsive mode, characterized by strong downward momentum.

  • Primary Wave Structure: Gray wave 3, initiated after the completion of gray wave 2, indicates the continuation of the bearish phase.
  • Current Position: Gray wave 3 is unfolding within orange wave 3. This stage marks the intensification of the downward trajectory.
  • Future Projection: Following the completion of gray wave 3, a transition to gray wave 4, a corrective phase, is anticipated.

CAC 40 Key Level for Invalidation

  • The invalidation level is set at 7618.09.

  • If the index surpasses this threshold, the current wave count and bearish outlook will be invalidated.

  • This level is crucial for risk management and confirms the ongoing bearish impulsive phase.

Summary

  • Bearish Trend: The CAC 40 index remains in a bearish phase, with gray wave 3 actively developing as part of orange wave 3.

  • Momentum: The completion of gray wave 2 marked the beginning of this impulsive decline.

  • Validation: The bearish outlook remains intact below the invalidation level of 7618.09.

  • Projection: Continued downward movement in gray wave 3 is expected, followed by a corrective gray wave 4 phase.

CAC-40-Index-Daily-C...


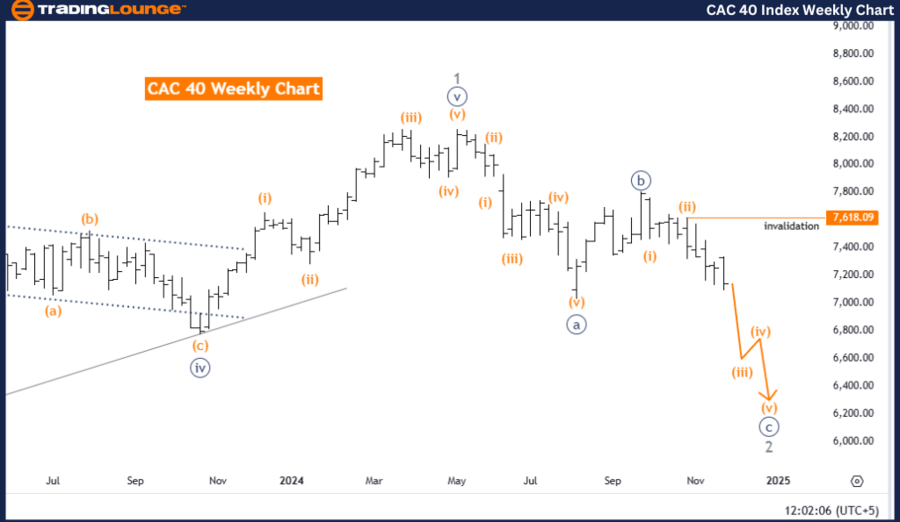
CAC 40 (France) Elliott Wave Analysis - TradingLounge Weekly Chart

CAC 40 (France) Elliott Wave Technical Analysis

CAC 40 Technical Overview

Function: Counter Trend

Mode: Impulsive

Structure: Orange Wave 3

Position: Navy Blue Wave C

Direction Next Higher Degrees: Orange Wave 4

Details: Orange wave 2 appears complete; orange wave 3 of 3 is currently developing.

Wave Cancel Invalidation Level: 7618.09

CAC 40 Analysis Overview

This weekly chart analysis uses Elliott Wave Theory to identify a counter-trend phase in the CAC 40 Index. The market remains in an impulsive mode, moving strongly within orange wave 3 as part of a broader corrective structure.

  • Progression: The completion of orange wave 2 confirms the continuation of the current trend.
  • Current Position: Navy blue wave C, a critical element of orange wave 3, is actively unfolding.
  • Future Projection: Further downward movement is expected before transitioning to orange wave 4, which will serve as a corrective phase within the higher-degree wave structure.

CAC 40 Key Level for Invalidation

  • The invalidation level is set at 7618.09.

  • If the index surpasses this threshold, the current wave count and counter-trend outlook will be invalidated.
  • This level acts as a key indicator for managing risk and confirming the counter-trend structure.

Summary

  • Counter-Trend: The CAC 40 index is in a counter-trend phase, with orange wave 3 actively unfolding after orange wave 2 completion.

  • Momentum: Navy blue wave C marks the ongoing impulsive movement within the structure.

  • Validation: The counter-trend outlook holds as long as the index remains below the invalidation level of 7618.09.

  • Projection: Further development in orange wave 3 is expected before transitioning into a corrective phase in orange wave 4.

Technical Analyst: Malik Awais

Source: visit Tradinglounge.com and learn From the Experts Join TradingLounge Here 

Previous: TASI Index Elliott Wave Technical Analysis

VALUE Offer - Buy 1 Month & Get 3 Months!Click here

Access 7 Analysts Over 200 Markets Covered. Chat Room With Support

CAC-40-Index-Weekly-...

Related

Euro/British Pound Forex trading and improve your strategy with accurate EURGBP Elliott Wave forecasts and signals

Euro/British Pound Forex trading and improve your strategy with accurate EURGBP Elliott Wave forecasts and signals

This comprehensive EURGBP Elliott Wave analysis provides a detailed look into the market’s current ...

Read More >
Dynamics Between U.S.Dollar /Canadian Dollar (USD/CAD) Forex Elliott Wave Technical Analysis

Dynamics Between U.S.Dollar /Canadian Dollar (USD/CAD) Forex Elliott Wave Technical Analysis

This article provides a detailed Elliott Wave analysis of the USD/CAD currency pair, focusing on cur...

Read More >
USDCAD Forex Elliott Wave Technical Analysis: In-Depth Insights on U.S. Dollar to Canadian Dollar Trends Currency Pair

USDCAD Forex Elliott Wave Technical Analysis: In-Depth Insights on U.S. Dollar to Canadian Dollar Trends Currency Pair

Gain insights into the USDCAD Elliott Wave analysis with a focus on a bullish trend and impulsive wa...

Read More >
V300AEQ ETF UNITS – VAS Stock Analysis & Vanguard Elliott Wave Technical Forecast

V300AEQ ETF UNITS – VAS Stock Analysis & Vanguard Elliott Wave Technical Forecast

Our latest Elliott Wave analysis on ASX: V300AEQ ETF Units – VAS reveals that wave 2-red has conclu...

Read More >
United Health Group Inc.(UNH:NYSE) Elliott Wave Technical Analysis 19 December 23

United Health Group Inc.(UNH:NYSE) Elliott Wave Technical Analysis 19 December 23

United Health Group Inc.(UNH: NYSE) Elliott Wave Technical Analysis 4-hour and 1-hour Chart dated 19...

Read More >
Euro/U.S. Dollar (EURUSD) Elliott Wave Analysis: Forex Market Trends, Price Action Predictions, and Trading Strategy Insights

Euro/U.S. Dollar (EURUSD) Elliott Wave Analysis: Forex Market Trends, Price Action Predictions, and Trading Strategy Insights

This EUR/USD Elliott Wave Analysis provides a detailed technical outlook on the Forex market trend, ...

Read More >

$1 for 2 Weeks

then $29 a month!

What a Special Offer!

Trade Recommendations

Unleash the power of deversified trading with our comprehensive portfolio, covering 250+ markets:

  • Stock Trades
  • Crypto Trades
  • Forex Trades
  • Commodity Trades
Elliott Wave Analysis

Gain a competitive edge with expert insights and AI-powered Elliott Wave charting into:

  • Global Indices
  • US Stocks & ASX Stocks
  • Forex & Crypto
  • Commodities
Top-Notch Trading Tools

Equip yourself with the tools of success:

  • Real-time Chat rooms
  • Elliott Wave Algorithm
  • Portfolio tools
  • TradingLevels
  • Screener
  • Trading Game
7 Elliott Wave Analysts

Stay ahead of the market with daily charts and insightful videos
Your secret to strategic trading!

JOIN HERE


Welcome to TradingLounge (ASIC A.R.No. 321187), specialists in trades, trading education and technical analysis, covering stocks, indices, commodities, forex and cryptocurrencies.

When you join TradingLounge you have access to everything we offer, including trade tools, educational content and a social platform to chat with like-minded investors.

Read more

@Copyright 2024 by tradinglounge.com

Contact Us

Australian no: 02 4787 6020

International no: +61 (2) 47876020

Pay with:

Find us on