02Jul

Caterpillar Inc. (CAT) Elliott Wave Analysis Reveals Daily Wave {iii} Nears Completion and Hourly Wave (v) Eyes $400 Resistance Level

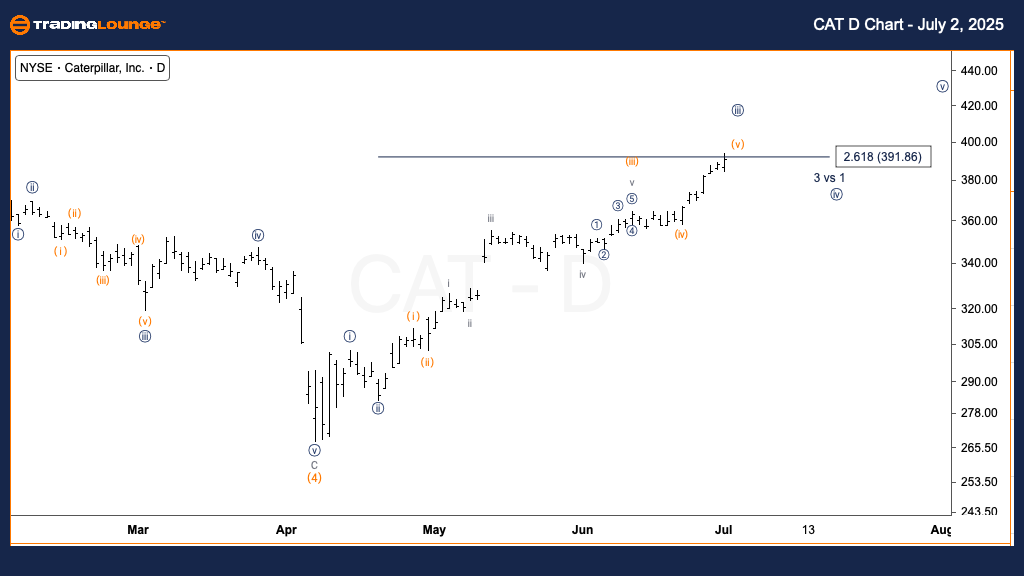
Caterpillar Inc. (CAT) – Elliott Wave Forecast – Trading Lounge (Daily Chart)

CAT Technical Analysis Summary

FUNCTION: Trend

MODE: Motive

STRUCTURE: Impulsive

POSITION: Wave {iii} of 1

DIRECTION: Uptrend toward completion of Wave {iii}

DETAILS: Wave {iii} has extended to 2.618x the size of Wave {i}, indicating maturity

Caterpillar Inc. (NYSE: CAT) continues to show strong bullish momentum on the daily chart, moving through a clear impulsive Elliott Wave pattern. The stock is currently advancing in Wave {iii} of Wave 1, with price action extending approximately 2.618 times the length of Wave {i}, a typical Fibonacci ratio that often marks the completion of Wave {iii}. This extension signals that a short-term high could be forming. While the long-term trend remains bullish, traders should be alert for potential resistance levels and consolidation signals that may precede the development of Wave {iv}.

CAT-d-us-stock-chart...


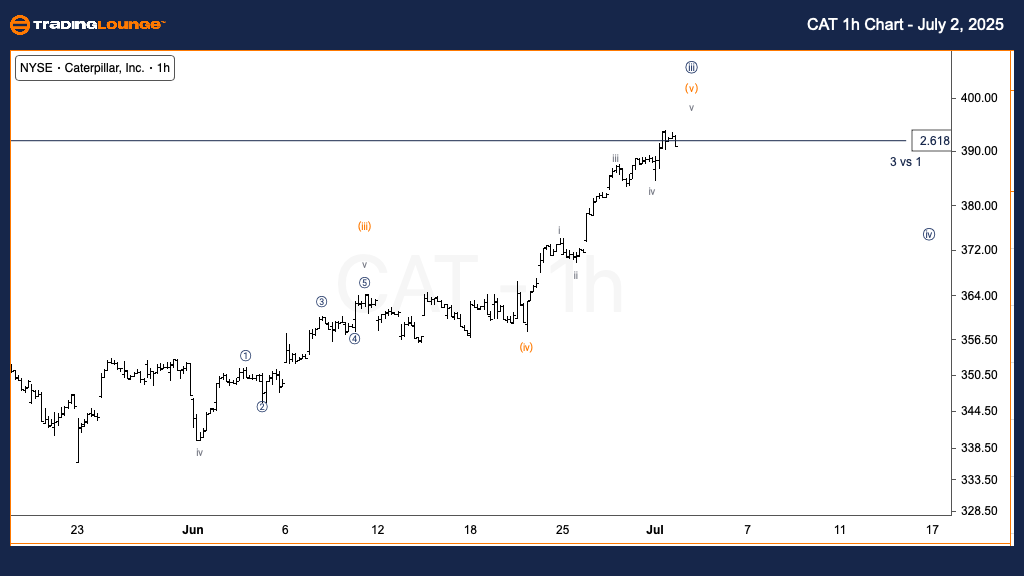
Caterpillar Inc. (CAT) – Elliott Wave Forecast – Trading Lounge (1-Hour Chart)

CAT Technical Analysis Summary

FUNCTION: Trend

MODE: Motive

STRUCTURE: Impulsive

POSITION: Wave (v) of {iii}

DIRECTION: Uptrend nearing end of Wave (v)

DETAILS: Price action targets $400 area as Wave (v) finalizes

On the 1-hour chart, Caterpillar (CAT) is nearing the final phase of its current bullish impulse, progressing through Wave (v) of Wave {iii}. The stock is approaching the $400 resistance level, signaling the potential completion of Wave (v). As this sub-wave wraps up, traders should anticipate a corrective Wave {iv}, which may offer a new buying opportunity aligned with the ongoing Elliott Wave structure. Close attention to intraday indicators and exhaustion signals is essential for optimizing trade entries and exits.

Technical Analyst: Alessio Barretta

Source: Visit Tradinglounge.com and learn from the Experts. Join TradingLounge Here 

Previous: Fortinet Inc. (FTNT) Elliott Wave Technical Analysis

VALUE Offer - Buy 1 Month & Get 3 Months!Click here

Access 7 Analysts Over 200 Markets Covered. Chat Room With Support

CAT-1h-us-stock-char...

Related

Learn about BTC price movements, trading strategies, and technical indicators: Bitcoin (BTCUSD) Elliott Wave analysis

Learn about BTC price movements, trading strategies, and technical indicators: Bitcoin (BTCUSD) Elliott Wave analysis

Get an in-depth Elliott Wave analysis of Bitcoin (BTCUSD) on both daily and 4-hour charts. Learn abo...

Read More >
 Bovespa Index Elliott Wave Technical Analysis Highlights Impulsive Trend and Trading Strategy in Brazil’s Stock Market Analysis

Bovespa Index Elliott Wave Technical Analysis Highlights Impulsive Trend and Trading Strategy in Brazil’s Stock Market Analysis

Elliott Wave count for the Bovespa Index, highlighting impulsive wave development and potential trad...

Read More >
URW Elliott Wave Analysis for ASX Stock Unibail Rodamco Westfield Provides Critical Insights into Potential Stock Price Movements

URW Elliott Wave Analysis for ASX Stock Unibail Rodamco Westfield Provides Critical Insights into Potential Stock Price Movements

Our latest Elliott Wave analysis for ASX UNIBAIL-RODAMCO-WESTFIELD (URW) provides critical insights ...

Read More >
Unlocking ASX Trading Success: BRAMBLES LIMITED - BXB Stock Analysis & Elliott Wave Technical Forecast

Unlocking ASX Trading Success: BRAMBLES LIMITED - BXB Stock Analysis & Elliott Wave Technical Forecast

Our in-depth Elliott Wave analysis of BRAMBLES LIMITED (BXB) on the Australian Stock Exchange (ASX) ...

Read More >
New Zealand Dollar/U.S.Dollar (NZDUSD) Forex Elliott Wave Technical Analysis: Comprehensive Market Forecast

New Zealand Dollar/U.S.Dollar (NZDUSD) Forex Elliott Wave Technical Analysis: Comprehensive Market Forecast

This article provides an in-depth Elliott Wave Analysis of the NZDUSD pair on both the daily and 4-h...

Read More >
Expert Tips on Navigating the Market's Bullish and Bearish Signals: Bovespa Index Elliott Wave Technical Analysis

Expert Tips on Navigating the Market's Bullish and Bearish Signals: Bovespa Index Elliott Wave Technical Analysis

This article provides an in-depth Bovespa Index analysis, focusing on Elliott Wave strategies, marke...

Read More >

$1 for 2 Weeks

then $29 a month!

What a Special Offer!

Trade Recommendations

Unleash the power of deversified trading with our comprehensive portfolio, covering 250+ markets:

  • Stock Trades
  • Crypto Trades
  • Forex Trades
  • Commodity Trades
Elliott Wave Analysis

Gain a competitive edge with expert insights and AI-powered Elliott Wave charting into:

  • Global Indices
  • US Stocks & ASX Stocks
  • Forex & Crypto
  • Commodities
Top-Notch Trading Tools

Equip yourself with the tools of success:

  • Real-time Chat rooms
  • Elliott Wave Algorithm
  • Portfolio tools
  • TradingLevels
  • Screener
  • Trading Game
7 Elliott Wave Analysts

Stay ahead of the market with daily charts and insightful videos
Your secret to strategic trading!

JOIN HERE


Welcome to TradingLounge (ASIC A.R.No. 321187), specialists in trades, trading education and technical analysis, covering stocks, indices, commodities, forex and cryptocurrencies.

When you join TradingLounge you have access to everything we offer, including trade tools, educational content and a social platform to chat with like-minded investors.

Read more

@Copyright 2024 by tradinglounge.com

Contact Us

Australian no: 02 4787 6020

International no: +61 (2) 47876020

Pay with:

Find us on