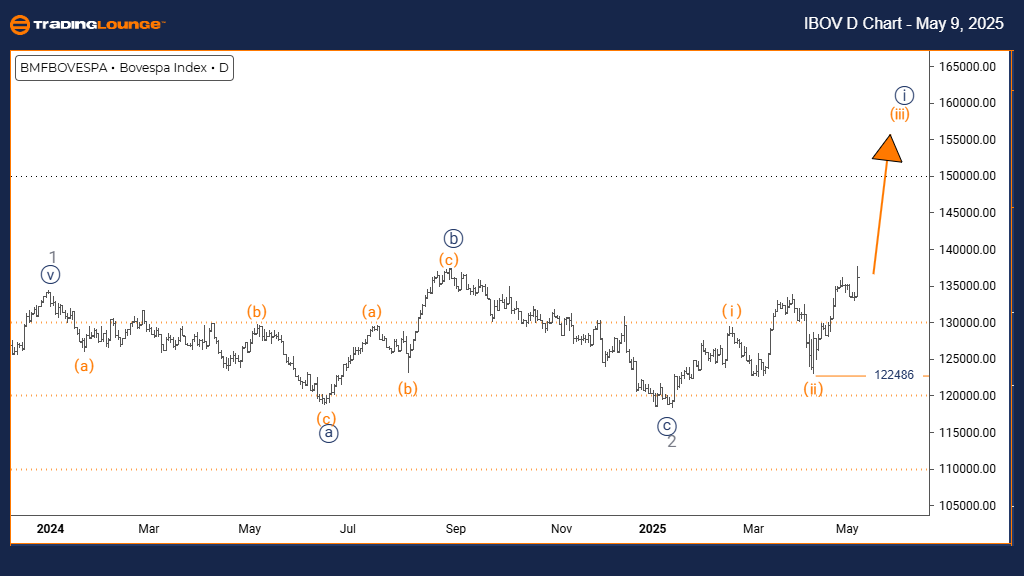
Bovespa Index Elliott Wave Analysis - Trading Lounge Daily Chart
Bovespa Elliott Wave Technical Analysis
FUNCTION: Bullish Market Trend
MODE: Impulsive Movement
STRUCTURE: Orange Wave 3 Formation
POSITION: Developing Navy Blue Wave 1
NEXT DIRECTION (LOWER DEGREES): Formation of Orange Wave 4
DETAILS: Orange Wave 2 appears complete; Orange Wave 3 is actively unfolding
WAVE CANCEL/INVALID LEVEL: 122,486
Market Overview and Technical Positioning
The daily Bovespa Index analysis shows a prevailing bullish trend marked by impulsive price action. The current Elliott Wave structure identifies Orange Wave 3 in progress within the larger framework of Navy Blue Wave 1. This follows the apparent completion of Orange Wave 2, a phase often preceding the strongest segment in a five-wave advance.
This pattern suggests continued bullish momentum and increased buying pressure. It aligns with the early stages of a new bullish cycle, reinforcing a positive market outlook and investor sentiment.
Next Wave Scenario and Expectations
After Orange Wave 3 concludes, a corrective move in the form of Orange Wave 4 is projected in the lower degrees. This could present a brief consolidation phase within the broader uptrend. The invalidation level is set at 122,486—if breached, it would require a reassessment of the current bullish scenario.
Until this threshold is violated, the structure suggests more upward price action. The impulsive nature of this wave count supports a continuation of the bullish trajectory through the remainder of Wave 3.
Trading Strategy and Risk Management
This technical wave setup offers a structured basis for identifying trade opportunities and managing risk. With Orange Wave 3 in progress and Orange Wave 4 anticipated, traders should track price behavior for pullbacks that may present favorable entry points. Maintaining focus on trend development and the 122,486 invalidation level is essential for navigating the ongoing uptrend.
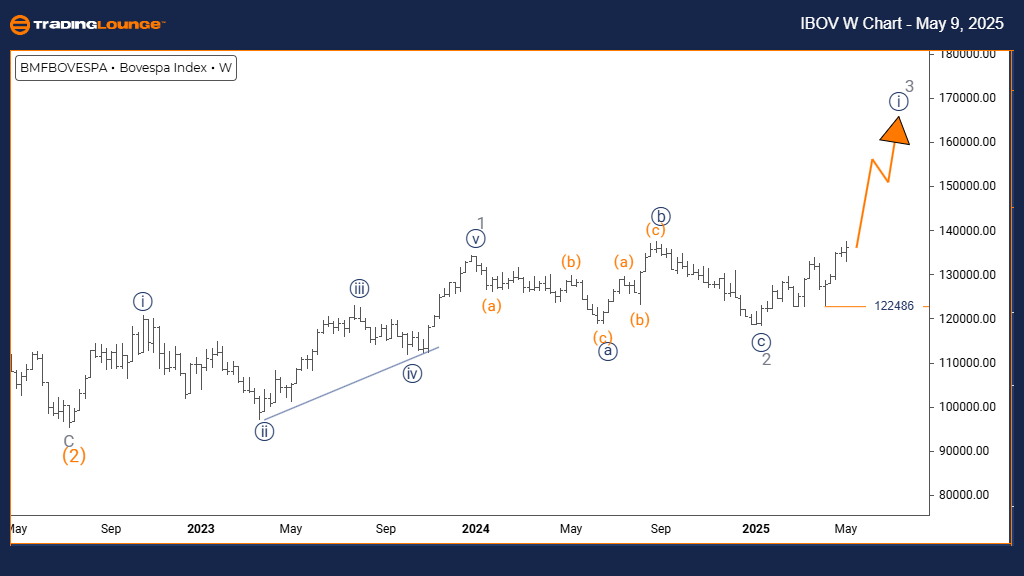
Bovespa Index Elliott Wave Analysis - Trading Lounge Weekly Chart
Bovespa Elliott Wave Technical Analysis
FUNCTION: Long-Term Bullish Trend
MODE: Impulsive Price Structure
STRUCTURE: Navy Blue Wave 1 within Gray Wave 3
POSITION: Advancing Gray Wave 3
NEXT DIRECTION (LOWER DEGREES): Ongoing Navy Blue Wave 1
DETAILS: Gray Wave 2 appears finalized; Navy Blue Wave 1 is unfolding
WAVE CANCEL/INVALID LEVEL: 122,486
Weekly Market Structure and Trend Outlook
The weekly Bovespa Index chart highlights a sustained bullish structure driven by impulsive movement. The wave analysis shows the progression of Navy Blue Wave 1 within the broader pattern of Gray Wave 3. Completion of Gray Wave 2 suggests that a new upward phase has begun.
As Navy Blue Wave 1 gains momentum, it marks a crucial stage in the longer-term bullish cycle. This reinforces strong buying interest and signals further growth potential in the Bovespa Index.
Wave Forecast and Pattern Continuation
The current wave count anticipates continued upward movement within Navy Blue Wave 1, contributing to the larger Gray Wave 3 formation. Traders should observe the key invalidation level at 122,486, which serves as a technical boundary for the active wave count.
As long as price action remains above this level, the bullish outlook remains valid. The impulsive wave structure indicates the potential for further gains and supports a strong uptrend in the medium to long term.
Long-Term Strategy and Investment Insight
This weekly wave analysis supports a bullish investment stance. With Navy Blue Wave 1 in motion, traders and investors can use this framework to identify entry points and manage risk effectively. The 122,486 level should be monitored as a significant support area, ensuring strategic alignment with ongoing trend dynamics.
Technical Analyst: Malik Awais
Source: Visit Tradinglounge.com and learn from the Experts. Join TradingLounge Here
Previous: Euro Stoxx 50 Elliott Wave Technical Analysis
VALUE Offer - Buy 1 Month & Get 3 Months!Click here
Access 7 Analysts Over 200 Markets Covered. Chat Room With Support