Euro Stoxx 50 Elliott Wave Analysis - Trading Lounge Day Chart
Euro Stoxx 50 Wave Technical Analysis
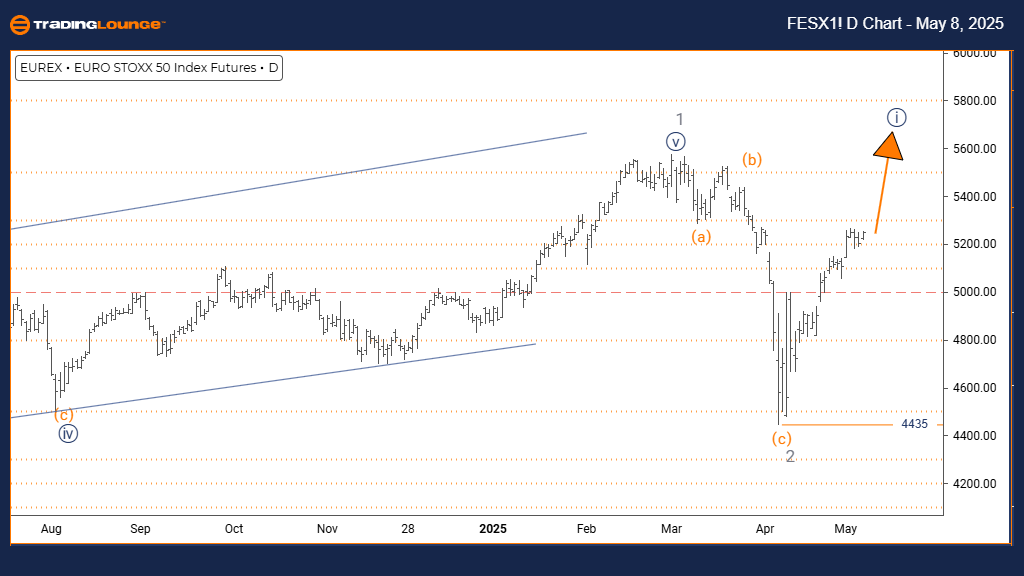
FUNCTION: Bullish Trend
MODE: Impulsive
STRUCTURE: Navy Blue Wave 1
POSITION: Gray Wave 3
DIRECTION NEXT LOWER DEGREES: Navy Blue Wave 2
DETAILS: Gray wave 2 looks completed. Navy blue wave 1 of 3 is now unfolding. Invalidation level set at 4435.
The Euro Stoxx 50 Elliott Wave Analysis on the daily chart indicates a bullish trend. The market currently pushes upward with strong momentum. The structure is part of an impulsive wave, specifically inside navy blue wave 1, nested within the broader gray wave 3. This scenario supports ongoing bullish strength, anticipating navy blue wave 2 formation after completing navy blue wave 1.
The analysis confirms that gray wave 2 seems finished. Now, the focus shifts to navy blue wave 1 of gray wave 3, which reinforces the bullish sentiment. The invalidation level stands at 4435. A price movement below this point would negate the bullish setup and suggest a shift in the wave structure.
The trend remains decisively bullish, and the impulsive mode highlights strong buying pressure. Situated inside gray wave 3 and advancing through navy blue wave 1, buyers retain control, increasing the probability of further gains. Traders are encouraged to watch for bullish continuation patterns, keeping the invalidation level in mind for effective risk control.
In conclusion, the Euro Stoxx 50 shows a clear bullish phase on the daily timeframe. The current wave structure favors more upward movement under navy blue wave 1 within gray wave 3. Close attention must be paid to the 4435 invalidation level, as a break below it could question the bullish projection. This Elliott Wave analysis offers traders a detailed roadmap of the market's potential direction and stresses the importance of key price levels.
Euro Stoxx 50 Elliott Wave Analysis - Trading Lounge Weekly Chart
Euro Stoxx 50 Wave Technical Analysis
FUNCTION: Bullish Trend
MODE: Impulsive
STRUCTURE: Gray Wave 3
POSITION: Orange Wave 3
DIRECTION NEXT HIGHER DEGREES: Gray Wave 3 (Started)
DETAILS: Gray wave 2 has likely ended. Gray wave 3 of 3 is active now. Invalidation level at 4435.
The Euro Stoxx 50 Elliott Wave Analysis on the weekly chart continues to reflect a strong bullish trend. The market remains in an impulsive wave movement, driving steady upward strength. The structure, classified as gray wave 3, sits within the broader orange wave 3, signaling an aggressive bullish phase following the completion of gray wave 2.
At higher degrees, the expectation is for the gray wave 3 to push further, strengthening the overall bullish outlook. The conclusion of gray wave 2 confirms that the previous correction phase has ended and that bullish forces are active again. It is crucial to monitor the invalidation level at 4435. A dip to or below this price would invalidate the current bullish wave count and could suggest a potential market reversal or a deeper pullback.
This Elliott Wave analysis emphasizes that buyers still dominate, and the impulsive structure supports firm upward momentum. Traders should focus on identifying bullish confirmation signals while remaining cautious around the invalidation point to protect capital.
In conclusion, the Euro Stoxx 50 sustains its bullish trend on the weekly timeframe. The rise under gray wave 3 within orange wave 3 suggests more upside ahead. Keeping a close eye on the 4435 support level is essential, as a break lower could alter the bullish structure. This comprehensive Elliott Wave view provides a clear perspective on the market’s likely path, with key levels playing a critical role in confirming or challenging the bullish bias.
Technical Analyst: Malik Awais
Source: Visit Tradinglounge.com and learn from the Experts. Join TradingLounge Here
Previous: TASI INDEX Elliott Wave Technical Analysis
VALUE Offer - Buy 1 Month & Get 3 Months!Click here
Access 7 Analysts Over 200 Markets Covered. Chat Room With Support
