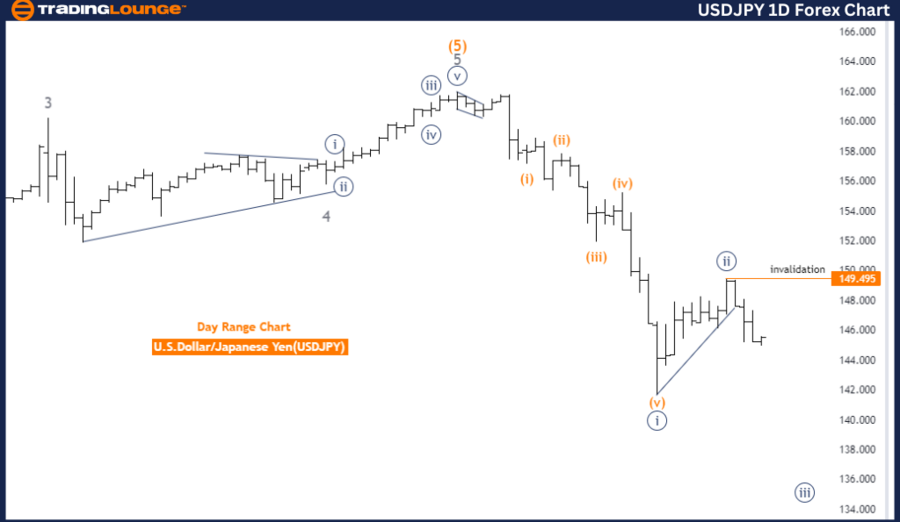
USDJPY Elliott Wave Analysis - Trading Lounge Day Chart
U.S. Dollar/Japanese Yen (USDJPY) Day Chart Analysis
USDJPY Elliott Wave Technical Analysis
- Function: Trend
- Mode: Impulsive
- Structure: Navy Blue Wave 3
- Position: Gray Wave 1
- Next Lower Degrees Direction: Navy Blue Wave 3 (initiated)
- Details: Navy Blue Wave 2 appears completed; Navy Blue Wave 3 is now active.
- Wave Cancel Invalid Level: 149.495
The USD/JPY currency pair, according to Elliott Wave theory on the daily chart, is currently in a trend phase characterized by an impulsive movement mode. The primary structure observed is Navy Blue Wave 3, which indicates a strong and ongoing downward trend.
The market currently stands at Gray Wave 1, signaling the start of the first phase of a larger downward movement. This Gray Wave 1 is a component of the broader Navy Blue Wave 3, which has already begun, suggesting sustained bearish momentum in the market.
Prior to the onset of Navy Blue Wave 3, the market completed Navy Blue Wave 2, a corrective phase that typically occurs before a strong upward movement. The completion of Navy Blue Wave 2 marks the end of the correction and the beginning of a new impulsive wave, indicating the continuation of the downtrend as Navy Blue Wave 3 progresses.
The analysis highlights that the market's direction aligns with the next lower degrees of trend, emphasizing the continuation of Navy Blue Wave 3. This wave is significant in Elliott Wave analysis, often representing a substantial and sustained price movement, reinforcing the expectation of further decline in the USD/JPY market.
A crucial level to monitor is 149.495, identified as the wave cancel invalid level. If the market drops below this level, the current Elliott Wave count would be invalidated, suggesting that the anticipated downward movement may not proceed as expected. This level serves as a key threshold for traders, who should reassess the market structure if breached.
Summary: The USD/JPY daily chart analysis indicates that the market is in an impulsive trend phase, with Navy Blue Wave 3 currently unfolding after the completion of Navy Blue Wave 2. The downward movement is expected to persist, with 149.495 being a critical level to watch for potential changes in the market's direction.
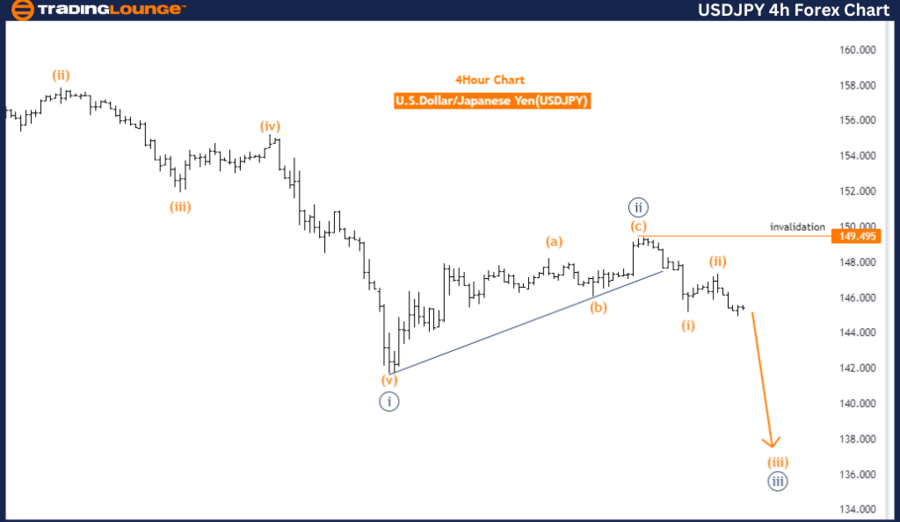
USDJPY Elliott Wave Analysis - Trading Lounge 4-Hour Chart
U.S. Dollar/Japanese Yen (USDJPY) 4-Hour Chart Analysis
USDJPY Currency Pair Analysis
- Function: Trend
- Mode: Impulsive
- Structure: Orange Wave 3
- Position: Navy Blue Wave 3
- Next Lower Degrees Direction: Orange Wave 3 (initiated)
- Details: Orange Wave 2 of 1 appears completed; Orange Wave 3 is now active.
- Wave Cancel Invalid Level: 149.495
The USD/JPY currency pair, as analyzed using Elliott Wave theory on the 4-hour chart, is currently exhibiting a trend phase marked by impulsive movement. The primary structure identified in this analysis is Orange Wave 3, indicating the continuation of a strong downward trend.
The market is presently within Navy Blue Wave 3, which is part of the larger Orange Wave 3 structure. This positioning indicates the market is experiencing a significant downward movement, typical of wave 3 in Elliott Wave analysis, often recognized as the most powerful and extended wave within an impulsive sequence.
Before this stage, the market completed Orange Wave 2, a corrective phase that generally occurs before a strong upward movement. The completion of Orange Wave 2 suggests the end of a short-term correction and the beginning of the next impulsive wave, Orange Wave 3. This wave is now active, indicating that the downward momentum is expected to continue.
The analysis confirms that the market's direction aligns with the next lower degrees, further supporting the ongoing development of Orange Wave 3. The completion of Orange Wave 2 signifies that the market has likely finished its corrective phase and is now focused on moving lower in Wave 3.
A critical level to monitor is 149.495, identified as the wave cancel invalid level. If the market dips below this level, the current Elliott Wave count would be invalidated, suggesting that the anticipated downward movement may not materialize as expected. This level is an important threshold for traders, as a breach could indicate a potential shift in the market structure.
Summary: The USD/JPY 4-hour chart analysis suggests that the market is in an impulsive trend phase, with Orange Wave 3 currently unfolding after the completion of Orange Wave 2. The downward movement is expected to continue, with 149.495 being a crucial level to watch for any changes in the market's direction.
Technical Analyst: Malik Awais
Source: visit Tradinglounge.com and learn From the Experts Join TradingLounge Here
Previous: EURUSD Elliott Wave Technical Analysis
Special Trial Offer - 0.76 Cents a Day for 3 Months! Click here
Access 7 Analysts Over 200 Markets Covered. Chat Room With Support