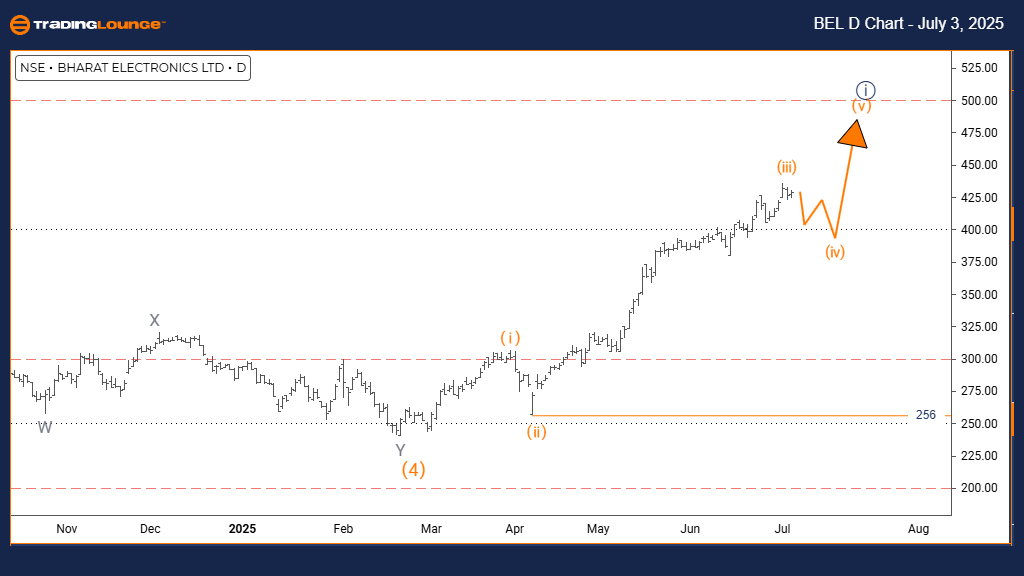
BHARAT ELECTRONICS Elliott Wave Analysis – Trading Lounge Daily Chart
BHARAT ELECTRONICS Elliott Wave Technical Forecast
FUNCTION: Counter-Trend
MODE: Corrective
STRUCTURE: Orange Wave 4
POSITION: Navy Blue Wave 1
NEXT HIGHER DEGREE DIRECTION: Orange Wave 5
DETAILS: Completion of Orange Wave 3 confirmed, Orange Wave 4 currently forming
Wave Invalidation Level: 256
The daily Elliott Wave chart of BHARAT ELECTRONICS shows the stock in a corrective counter-trend phase, highlighting a short-term pullback within an overall bullish market trend. Currently, orange wave 4 is developing as part of navy blue wave 1, indicating a pause before potential upward continuation.
Following the completion of orange wave 3, a typical corrective structure—orange wave 4—is now in progress. This correction phase retraces a part of the previous move and usually leads into orange wave 5, which may align with the larger bullish momentum.
The ongoing movement suggests a sideways or slightly bearish correction under orange wave 4, forming the initial part of navy blue wave 1. This aligns with broader upward expectations as the market prepares for a potential breakout in the next phase.
Watch the critical level of 256, which acts as the wave invalidation point. A drop below this threshold would nullify the current wave count and warrant a structural reassessment. Maintaining price above this level keeps the corrective outlook intact.
Traders should monitor the progression of orange wave 4 for signs of completion. Upon confirmation, the initiation of orange wave 5 may provide a buying opportunity aligned with the overall uptrend in BHARAT ELECTRONICS.
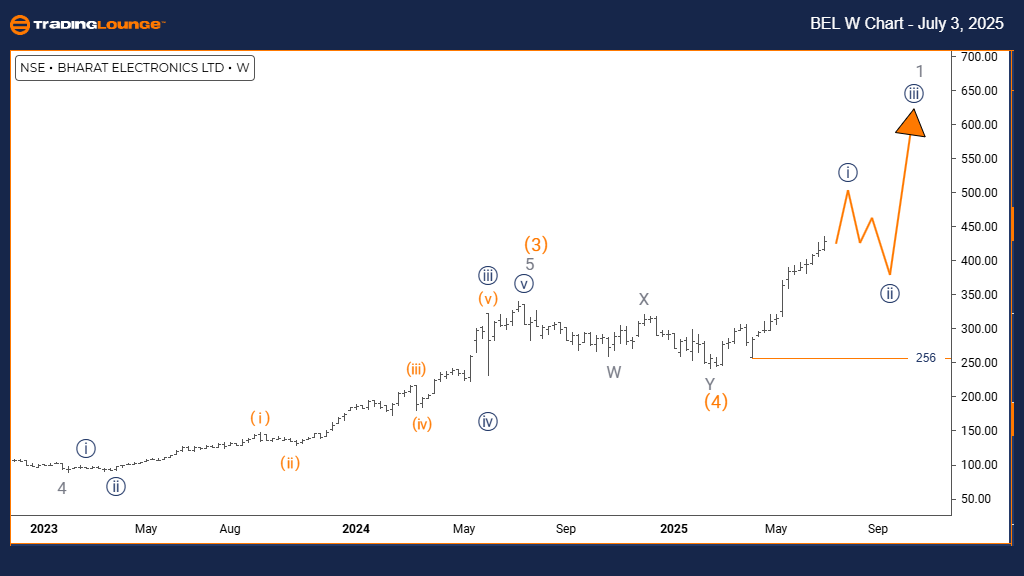
BHARAT ELECTRONICS Elliott Wave Analysis – Trading Lounge Weekly Chart
BHARAT ELECTRONICS Elliott Wave Technical Forecast
FUNCTION: Bullish Trend
MODE: Impulsive
STRUCTURE: Navy Blue Wave 1
POSITION: Gray Wave 1
NEXT LOWER DEGREE DIRECTION: Navy Blue Wave 2
DETAILS: Navy Blue Wave 1 remains in progress
Wave Invalidation Level: 256
The weekly Elliott Wave outlook for BHARAT ELECTRONICS reveals a strong bullish trend with price action firmly in impulsive mode. This structure, navy blue wave 1, is progressing within gray wave 1, marking the beginning stages of a major bullish cycle.
As navy blue wave 1 continues to unfold, it signifies the early phase of a new upward trend. Impulsive waves typically show decisive moves and, once completed, suggest a short-lived corrective navy blue wave 2 before trend resumption.
Key invalidation remains at 256. A break below this level would invalidate the wave structure and require a fresh outlook. However, holding above confirms the validity of the ongoing impulsive move.
With bullish energy persisting, navy blue wave 1's development indicates continued upside potential. Momentum and wave structure point to further gains ahead for BHARAT ELECTRONICS.
Technical Analyst: Malik Awais
Source: Visit Tradinglounge.com and learn from the Experts. Join TradingLounge Here
Previous: MAHINDRA & MAHINDRA Elliott Wave Technical Analysis
VALUE Offer - Buy 1 Month & Get 3 Months!Click here
Access 7 Analysts Over 200 Markets Covered. Chat Room With Support